Synopsis
Thunder, an abandoned young cat seeking shelter from a storm, stumbles into the strangest house imaginable, owned by an old magician and inhabited by a dazzling array of automatons and gizmos.
Scores
Overall Score
65.8
Popularity Percentile (Year)
50.3%
Box Office Percentile (Year)
86.0%
Review Aggregate
65.5
Critic Consensus
Critic reception is largely positive, with 76% of 29 logged reviews marked Fresh. Across reviews, critics repeatedly emphasize family-friendly, lighthearted, visually striking. Most critics frame the film as an effective delivery of its core style and intent.
family-friendlylightheartedvisually strikingscarystylizedfunny
Cast
| Cast | Year | Reported Salary | Inflation Adjusted | Notes |
|---|---|---|---|---|
| Cinda Adams | 2014 | $1,303,000 | $1,726,000 | (est) |
| George Babbit | 2014 | $802,000 | $1,063,000 | (est) |
| Murray Blue | 2014 | $604,000 | $800,000 | (est) |
| Kathleen Browers | 2014 | $494,000 | $654,000 | (est) |
| Joey Camen | 2014 | $422,000 | $560,000 | (est) |
| Grant George | 2014 | $372,000 | $492,000 | (est) |
| Shanelle Gray | 2014 | $334,000 | $442,000 | (est) |
| Nina Grillo | 2014 | $304,000 | $403,000 | (est) |
| Kyle Hebert | 2014 | $280,000 | $371,000 | (est) |
| Goldie Jonsie | 2014 | $260,000 | $344,000 | (est) |
| Kendra Leif | 2014 | $243,000 | $322,000 | (est) |
| Joey Lotsko | 2014 | $229,000 | $303,000 | (est) |
| Millie Mup | 2014 | $216,000 | $287,000 | (est) |
| Will Parks | 2014 | $205,000 | $272,000 | (est) |
| Sage Sommer | 2014 | $196,000 | $259,000 | (est) |
| Michael Sorich | 2014 | $187,000 | $248,000 | (est) |
| Doug Stone | 2014 | $179,000 | $238,000 | (est) |
| Joseph W. Terry | 2014 | $172,000 | $228,000 | (est) |
Aggregated Reviews
Rotten Tomatoes critic score76.0
RT critic review count29
Rotten Tomatoes audience score56.0
RT audience rating count2,500
IMDb rating6.2
IMDb votes7,785
Box Office ?
| Category | Year | Reported | Inflation Adjusted |
|---|---|---|---|
| Domestic | 2014 | $4,091 | $5,422 |
| International | 2014 | $64,193,112 | $85,075,537 |
| Worldwide | 2014 | $64,197,204 | $85,080,960 |
Earnings / Profitability
| Category | Year | Reported | Inflation Adjusted |
|---|---|---|---|
| Revenues | |||
| Theatrical Net Revenue | 2014 | $25,679,290 | $34,032,926 |
| Digital Rentals ? | 2014 | $162,000 | $214,700 |
| Digital Purchases ? | 2014 | $129,000 | $170,965 |
| Physical Rentals ? | 2014 | $185,000 | $245,182 |
| Physical Purchases ? | 2014 | $499,000 | $661,328 |
| TV & Streaming Revenue | 2014 | $10,200,000 | $13,518,124 |
| Total Revenues | 2014 | $36,854,290 | $48,843,224 |
| Expenses | |||
| Budget ? | 2014 | $34,000,000 | $45,060,415 |
| Print & Advertising (P&A) ? | 2014 | $2,035,000 (est) | $2,696,998 (est) |
| Participations | 2014 | $737,000 | $976,751 |
| Residuals ? | 2014 | $544,000 | $720,967 |
| Interest & Overhead | 2014 | $5,780,000 | $7,660,271 |
| Total Expenses | 2014 | $43,096,000 | $57,115,401 |
| Movie Net Profit or Loss | 2014 | $-6,241,710 | $-8,272,177 |
Similar Movies
| Poster | Movie | Year | Match | Overall | Est. Profit |
|---|---|---|---|---|---|
 | Toy Story 3 | 2010 | Shared genres: 6 | 98.0 | $216,158,051 |
 | Toy Story | 1995 | Shared genres: 6 | 97.9 | $171,576,210 |
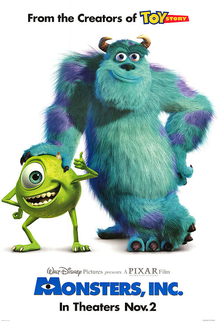 | Monsters, Inc. | 2001 | Shared genres: 6 | 97.4 | $142,461,262 |
 | Inside Out | 2015 | Shared genres: 6 | 97.4 | $115,137,525 |
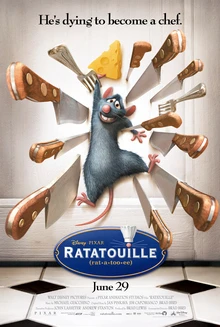 | Ratatouille | 2007 | Shared genres: 6 | 97.4 | $69,233,775 |