
The Conjuring Universe
Dynamic franchise page. New imported franchise entries will show automatically.
Movies10
Run2013-2025
Worldwide Gross$2,900,295,525
Total Budget$275,000,000
Budget to WW Gross Multiple10.55x
Total Profit$887,579,963
Total Profit (Inflation Adj)$1,111,322,354
Franchise Films
This franchise includes films released during the COVID-era disruption window of March 13, 2020 through June 30, 2021 and the recovery window of July 1, 2021 through December 31, 2021. Those titles are labeled in the table.
| Poster | Movie | Year | Overall | Popularity % | Box Office % | Worldwide | Profit/Loss (Est.) | Profit (Inflation Adj) |
|---|---|---|---|---|---|---|---|---|

|
2013 | 94.0 | 97.2% | 96.6% | $319M | $135M | $187M | |

|
2018 | 83.6 | 94.6% | 96.9% | $366M | $139M | $179M | |
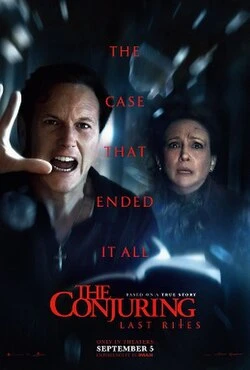
|
2025 | 79.3 | 72.8% | 94.8% | $499M | $171M | $171M | |

|
2017 | 87.6 | 90.2% | 95.5% | $307M | $125M | $165M | |

|
2014 | 82.2 | 91.7% | 95.7% | $257M | $116M | $158M | |

|
2016 | 93.2 | 97.2% | 96.2% | $321M | $79M | $107M | |
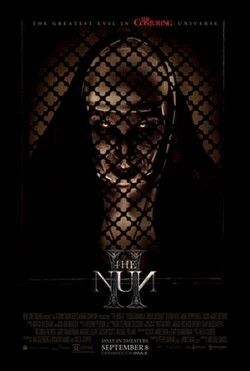
|
2023 | 82.9 | 84.1% | 94.6% | $270M | $54M | $58M | |

|
The Conjuring: The Devil Made Me Do It
COVID-era
|
2021 | 87.6 | 90.8% | 95.2% | $206M | $35M | $43M |

|
2019 | 86.8 | 89.9% | 95.3% | $231M | $21M | $27M | |

|
2019 | 77.8 | 85.2% | 92.1% | $123M | $13M | $17M |