Synopsis
When twelve ragtag teammates set out to play what should be a meaningless summer intramural baseball game, it ends up becoming the most important game of their lives.
Scores
Overall Score
24.1
Popularity Percentile (Year)
27.0%
Box Office Percentile (Year)
4.2%
Review Aggregate
52.4
Critic Consensus
Critic reception is mixed, with 25% of 8 logged reviews marked Fresh. Across reviews, critics repeatedly emphasize funny, character-driven, emotional. Common reservations focus on execution consistency, even when reviewers praise standout elements.
funnycharacter-drivenemotionalvisually strikingthought-provokingrealistic
Cast
| Cast | Year | Reported Salary | Inflation Adjusted | Notes |
|---|---|---|---|---|
| Joseph Mazzello | 2016 | $0 | $0 | (est) |
| Aaron Tveit | 2016 | $0 | $0 | (est) |
| Tyler Hoechlin | 2016 | $0 | $0 | (est) |
| Chace Crawford | 2016 | $0 | $0 | (est) |
| Philip Winchester | 2016 | $0 | $0 | (est) |
Aggregated Reviews
Rotten Tomatoes critic score25.0
RT critic review count8
Rotten Tomatoes audience score76.0
RT audience rating count250
IMDb rating6.3
IMDb votes1,619
Box Office ?
| Category | Year | Reported | Inflation Adjusted |
|---|---|---|---|
| Domestic | 2016 | $5,777 | $7,551 |
| International | 2016 | N/A | N/A |
| Worldwide | 2016 | $5,777 | $7,551 |
Earnings / Profitability
| Category | Year | Reported | Inflation Adjusted |
|---|---|---|---|
| Revenues | |||
| Theatrical Net Revenue | 2016 | $2,888 | $3,776 |
| Digital Rentals ? | 2016 | $111,000 | $145,086 |
| Digital Purchases ? | 2016 | $113,000 | $147,700 |
| Physical Rentals ? | 2016 | $97,000 | $126,787 |
| Physical Purchases ? | 2016 | $274,000 | $358,141 |
| TV & Streaming Revenue | 2016 | $75,000 | $98,031 |
| Total Revenues | 2016 | $672,888 | $879,521 |
| Expenses | |||
| Budget ? | 2016 | $250,000 (est) | $326,771 (est) |
| Print & Advertising (P&A) ? | 2016 | $80,000 (est) | $104,567 (est) |
| Participations | 2016 | $13,000 | $16,992 |
| Residuals ? | 2016 | $35,000 | $45,748 |
| Interest & Overhead | 2016 | $50,000 | $65,354 |
| Total Expenses | 2016 | $428,000 | $559,432 |
| Movie Net Profit or Loss | 2016 | $244,888 | $320,090 |
Similar Movies
| Poster | Movie | Year | Match | Overall | Est. Profit |
|---|---|---|---|---|---|
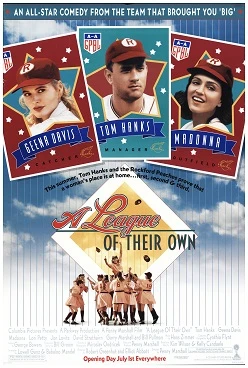 | A League of Their Own | 1992 | Shared genres: 6 | 92.3 | $88,255,465 |
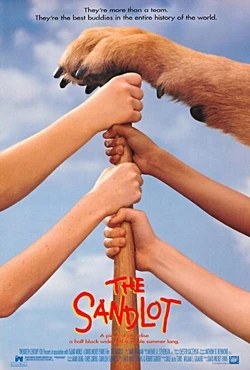 | The Sandlot | 1993 | Shared genres: 6 | 85.6 | $63,958,704 |
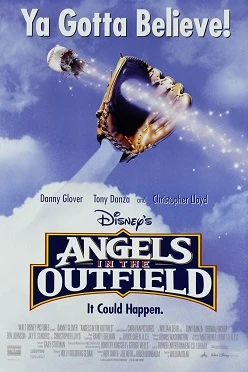 | Angels in the Outfield | 1994 | Shared genres: 6 | 80.9 | $72,021,624 |
 | Fever Pitch | 2005 | Shared genres: 6 | 76.1 | $25,708,939 |
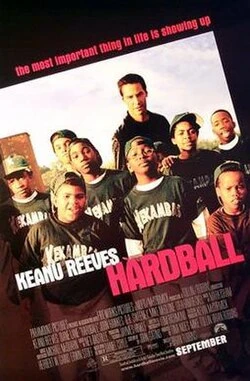 | Hardball | 2001 | Shared genres: 6 | 69.5 | $27,717,910 |