
Vertical Entertainment
Dynamic entity page generated from imported ScreenProfits movie metadata.
Distributor
Studio
Production Company
Movies71
Years2015-2025
Avg Score49.3
Worldwide Gross$112,654,545
Associated Movies
| Poster | Movie | Year | Overall | Popularity % | Box Office % | Worldwide | Profit/Loss (Est.) | Profit (Inflation Adj) |
|---|---|---|---|---|---|---|---|---|
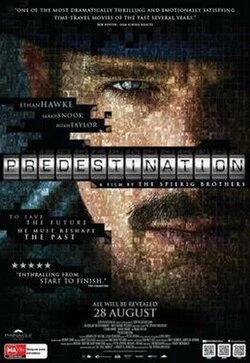
|
2015 | 80.9 | 96.0% | 63.0% | $5M | -$6M | -$7M | |

|
The Informer
COVID-era
|
2020 | 76.2 | 85.9% | 71.0% | $3M | -$67M | -$81M |

|
2024 | 74.6 | 84.2% | 56.1% | $2M | -$3M | -$3M | |
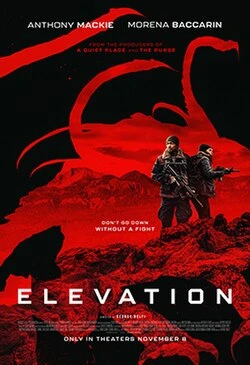
|
2024 | 69.3 | 77.0% | 62.8% | $4M | -$21M | -$21M | |

|
The Hating Game
Recovery period
|
2021 | 68.7 | 74.8% | 60.3% | $2M | -$24K | -$29K |

|
2025 | 67.8 | 70.8% | 61.1% | $4M | -$2M | -$2M | |

|
Follow Me
COVID-era
|
2020 | 67.3 | 66.9% | 75.4% | $4M | $192K | $239K |

|
After We Fell
Recovery period
|
2021 | 65.4 | 70.9% | 79.2% | $22M | $5M | $6M |

|
2018 | 65.0 | 74.0% | 49.4% | $577K | -$34M | -$42M | |

|
Archive
COVID-era
|
2020 | 64.6 | 80.2% | 41.2% | $243K | -$293K | -$364K |

|
Shadow in the Cloud
COVID-era
|
2021 | 64.3 | 75.1% | 55.9% | $1M | -$1M | -$2M |

|
2024 | 63.9 | 66.5% | 77.7% | $13M | $419K | $430K | |

|
2016 | 63.1 | 69.2% | 64.9% | $6M | -$5M | -$7M | |
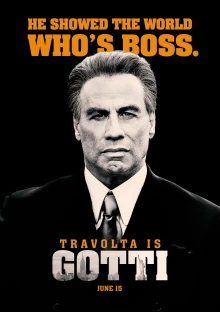
|
2018 | 62.5 | 72.9% | 69.3% | $6M | -$12M | -$15M | |

|
2025 | 62.1 | 66.6% | 54.5% | $2M | -$114M | -$114M | |

|
2017 | 61.9 | 66.1% | 72.1% | $10M | -$25M | -$32M | |

|
2016 | 61.5 | 72.9% | 35.5% | $133K | -$313K | -$420K | |

|
2024 | 61.4 | 52.0% | 64.8% | $4M | -$2M | -$2M | |

|
2023 | 61.3 | 65.7% | 64.4% | $4M | -$370K | -$391K | |
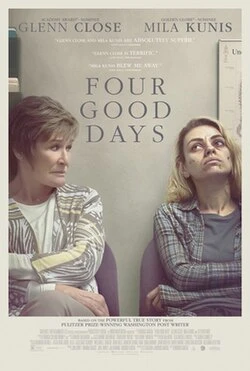
|
Four Good Days
COVID-era
|
2021 | 61.1 | 65.5% | 52.3% | $864K | -$384K | -$457K |

|
2017 | 60.7 | 72.8% | 43.4% | $398K | -$6M | -$8M | |

|
2025 | 60.1 | 65.1% | 66.4% | $6M | -$64M | -$64M | |
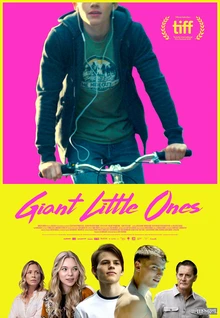
|
2019 | 59.0 | 66.7% | 34.3% | $182K | -$251K | -$316K | |

|
2024 | 57.8 | 58.5% | 45.7% | $810K | $76K | $86K | |

|
2023 | 57.2 | 61.2% | 51.2% | $1M | -$858K | -$906K | |
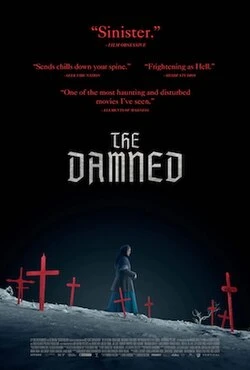
|
2025 | 56.2 | 58.3% | 47.7% | $1M | -$756K | -$756K | |

|
SAS: Rise of the Black Swan
COVID-era
|
2021 | 56.2 | 70.7% | 38.1% | $198K | -$264K | -$313K |

|
2016 | 54.5 | 61.2% | 31.5% | $91K | -$272K | -$365K | |
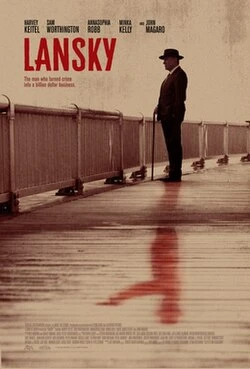
|
Lansky
COVID-era
|
2021 | 54.0 | 61.4% | 35.5% | $137K | -$6M | -$7M |
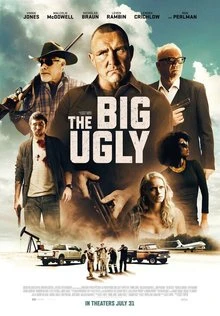
|
The Big Ugly
COVID-era
|
2020 | 53.9 | 56.4% | 49.7% | $515K | -$7M | -$8M |
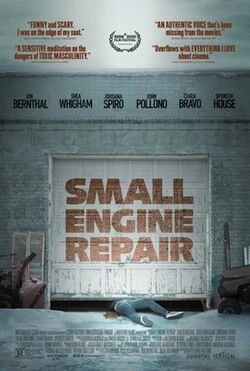
|
Small Engine Repair
Recovery period
|
2021 | 49.9 | 50.3% | 34.0% | $111K | -$253K | -$301K |
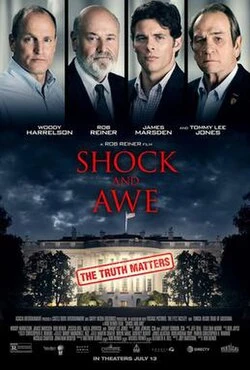
|
2018 | 49.3 | 63.2% | 35.7% | $182K | -$17M | -$22M | |
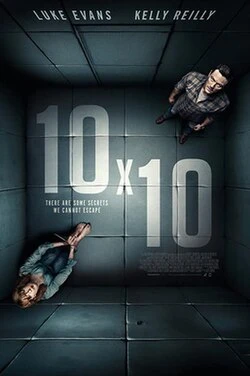
|
2018 | 48.5 | 67.4% | 24.6% | $68K | -$329K | -$422K | |
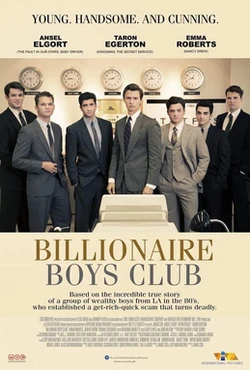
|
2016 | 48.5 | 57.5% | 45.7% | $542K | -$17M | -$22M | |
|
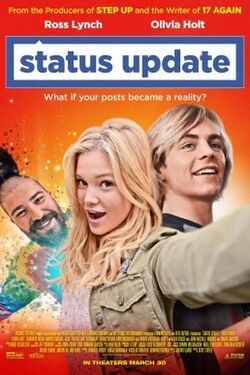
2018 | 48.3 | 57.7% | 45.9% | $416K | -$667K | -$855K | |

|
2018 | 47.7 | 55.5% | 31.7% | $128K | -$292K | -$375K | |

|
2024 | 47.5 | 41.7% | 40.6% | $553K | -$810K | -$831K | |
|
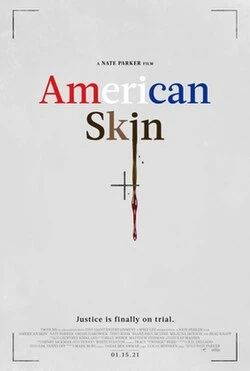
American Skin
COVID-era
|
2021 | 47.4 | 44.3% | 41.5% | $282K | -$6M | -$6M |

|
2022 | 47.3 | 56.9% | 41.2% | $266K | -$295K | -$324K | |

|
2025 | 47.2 | 42.2% | 40.6% | $706K | -$736K | -$736K | |

|
Gully
COVID-era
|
2021 | 46.9 | 71.2% | 16.9% | $23K | -$334K | -$396K |

|
2022 | 46.8 | 50.5% | 33.6% | $121K | -$265K | -$292K | |

|
2017 | 46.6 | 60.6% | 32.3% | $87K | -$152K | -$197K | |

|
Time Is Up
Recovery period
|
2021 | 45.3 | 43.0% | 42.0% | $301K | -$386K | -$459K |

|
Miss Juneteenth
COVID-era
|
2020 | 42.4 | 35.1% | 32.7% | $111K | -$3M | -$3M |

|
Infamous
COVID-era
|
2020 | 41.6 | 42.2% | 46.6% | $429K | -$207K | -$257K |

|
2023 | 41.5 | 56.0% | 17.8% | $58K | -$319K | -$337K | |

|
Human Capital
COVID-era
|
2020 | 41.5 | 60.8% | 7.6% | $7K | -$348K | -$433K |

|
The God Committee
Recovery period
|
2021 | 40.7 | 46.9% | 20.0% | $33K | -$323K | -$384K |

|
2017 | 40.3 | 46.7% | 33.3% | $98K | -$311K | -$409K |