Synopsis
When human forces discover the existence of the Vampire and Lycan clans, a war to eradicate both species commences. The vampire warrior Selene leads the battle against humankind.
Scores
Overall Score
80.7
Popularity Percentile (Year)
86.3%
Box Office Percentile (Year)
92.6%
Review Aggregate
47.5
Critic Consensus
Critic reception is largely negative, with 25% of 76 logged reviews marked Fresh. Across reviews, critics repeatedly emphasize thin plot, funny, gritty. Many reviews cite thin plot as the main reasons it falls short.
thin plotfunnygrittystylizedmacabrescaryupliftingdarkvisually striking
Cast
| Cast | Year | Reported Salary | Inflation Adjusted | Notes |
|---|---|---|---|---|
| Kate Beckinsale | 2012 | $5,477,000 | $7,483,000 | (est) |
| Stephen Rea | 2012 | $3,371,000 | $4,606,000 | (est) |
| Michael Ealy | 2012 | $2,538,000 | $3,468,000 | (est) |
| Theo James | 2012 | $2,075,000 | $2,836,000 | (est) |
| India Eisley | 2012 | $1,775,000 | $2,426,000 | (est) |
| Charles Dance | 2012 | $1,563,000 | $2,135,000 | (est) |
Aggregated Reviews
Rotten Tomatoes critic score25.0
RT critic review count76
Rotten Tomatoes audience score62.0
RT audience rating count50,000
IMDb rating6.3
IMDb votes165,606
Box Office ?
| Category | Year | Reported | Inflation Adjusted |
|---|---|---|---|
| Domestic | 2012 | $62,321,039 | $85,148,562 |
| International | 2012 | $97,791,632 | $133,611,651 |
| Worldwide | 2012 | $160,112,671 | $218,760,213 |
Earnings / Profitability
| Category | Year | Reported | Inflation Adjusted |
|---|---|---|---|
| Revenues | |||
| Theatrical Net Revenue | 2012 | $70,277,172 | $96,018,941 |
| Digital Rentals ? | 2012 | $4,729,000 | $6,461,182 |
| Digital Purchases ? | 2012 | $2,126,000 | $2,904,731 |
| Physical Rentals ? | 2012 | $7,495,000 | $10,240,338 |
| Physical Purchases ? | 2012 | $18,518,000 | $25,300,943 |
| TV & Streaming Revenue | 2012 | $15,580,260 | $21,287,141 |
| Total Revenues | 2012 | $118,725,432 | $162,213,275 |
| Expenses | |||
| Budget ? | 2012 | $70,000,000 | $95,640,244 |
| Print & Advertising (P&A) ? | 2012 | $75,112,000 (est) | $102,624,714 (est) |
| Participations | 2012 | $2,375,000 | $3,244,937 |
| Residuals ? | 2012 | $2,921,000 | $3,990,931 |
| Interest & Overhead | 2012 | $10,500,000 | $14,346,037 |
| Total Expenses | 2012 | $160,908,000 | $219,846,862 |
| Movie Net Profit or Loss | 2012 | $-42,182,568 | $-57,633,587 |
Similar Movies
| Poster | Movie | Year | Match | Overall | Est. Profit |
|---|---|---|---|---|---|
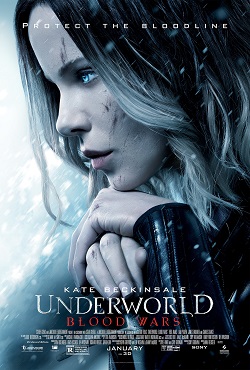 | Underworld: Blood Wars | 2017 | Shared franchise (1) | 76.9 | $-266,324 |
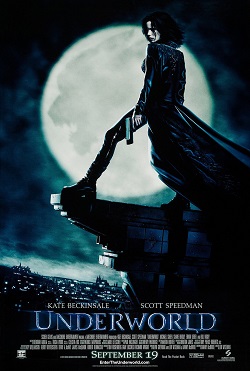 | Underworld | 2003 | Shared franchise (1) | 85.3 | $56,528,124 |
 | Underworld: Evolution | 2006 | Shared franchise (1) | 84.0 | $33,746,211 |
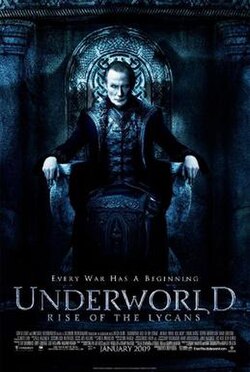 | Underworld: Rise of the Lycans | 2009 | Shared franchise (1) | 77.1 | $25,348,395 |
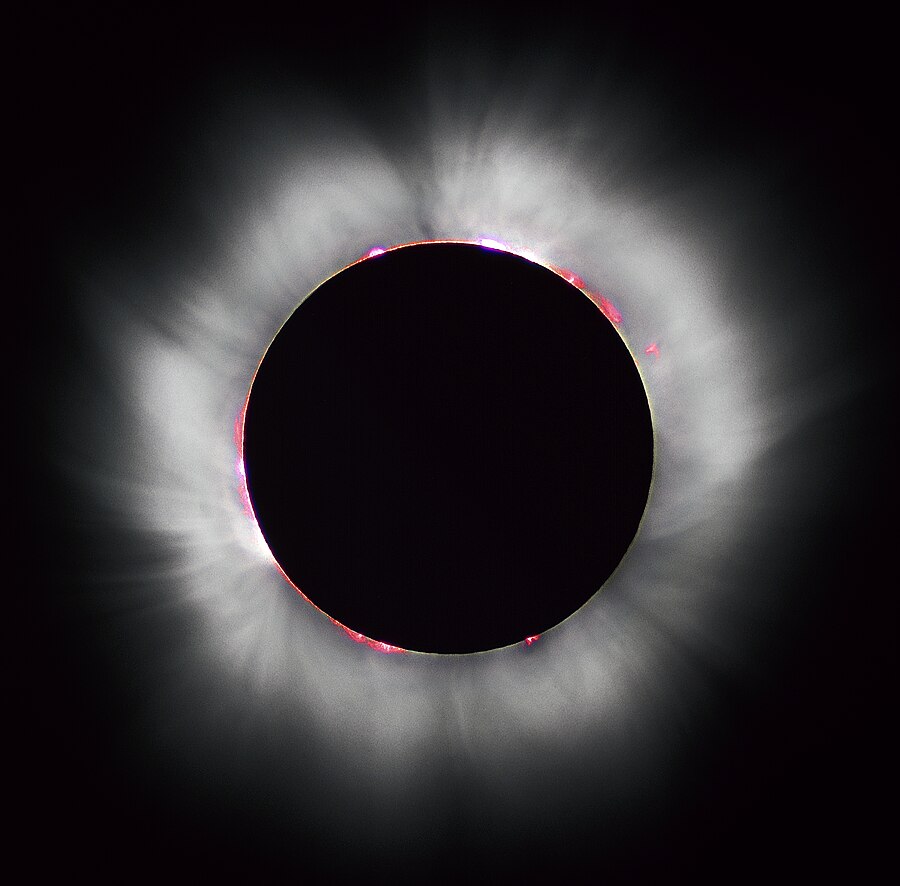 | The Twilight Saga: Eclipse | 2010 | Shared genres: 6 | 88.1 | $233,606,827 |