Screen Profits
Most Profitable Movies
Most Profitable Movies
Movies Decade
Genres
Franchises
Actor Net Worth Rankings
Back to movie
Unaccompanied Minors (2006) Similar Movies
20 similar titles
Similar Movies
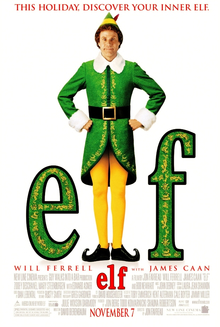
Elf
Year
2003
Overall
92.8
Est. Profit
$104,188,817
Aladdin
Year
1992
Overall
97.7
Est. Profit
$232,328,117
Shrek
Year
2001
Overall
95.9
Est. Profit
$196,186,888
Tangled
Year
2010
Overall
95.4
Est. Profit
$-31,230,690
Shrek 2
Year
2004
Overall
94.7
Est. Profit
$264,427,557
Enchanted
Year
2007
Overall
93.4
Est. Profit
$60,033,820
Aladdin
Year
2019
Overall
93.2
Est. Profit
$151,389,228
Elemental
Year
2023
Overall
91.6
Est. Profit
$-57,539,132
The Princess Bride
Year
1987
Overall
90.8
Est. Profit
$34,696,360
Happy Feet
Year
2006
Overall
90.8
Est. Profit
$63,605,364
Hercules
Year
1997
Overall
90.7
Est. Profit
$25,279,439
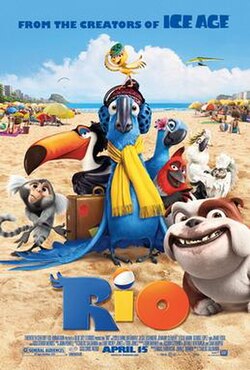
Rio
Year
2011
Overall
90.3
Est. Profit
$60,468,135
The Princess and the Frog
Year
2009
Overall
90.1
Est. Profit
$15,160,648
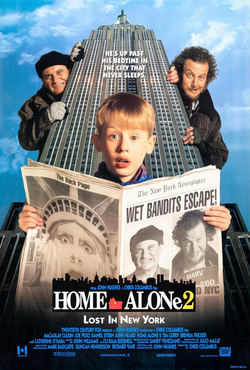
Home Alone 2: Lost in New York
Year
1992
Overall
89.6
Est. Profit
$142,138,736
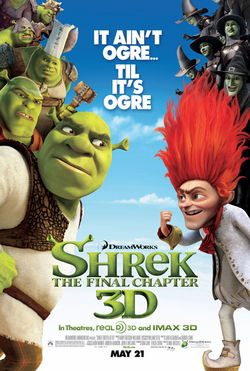
Shrek Forever After
Year
2010
Overall
89.2
Est. Profit
$41,746,326
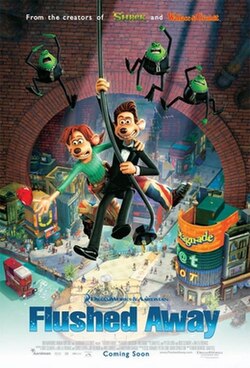
Flushed Away
Year
2006
Overall
88.6
Est. Profit
$-68,209,393
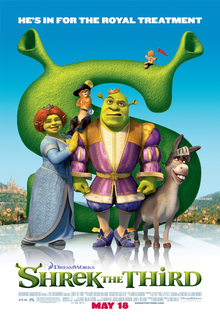
Shrek the Third
Year
2007
Overall
88.2
Est. Profit
$128,993,411
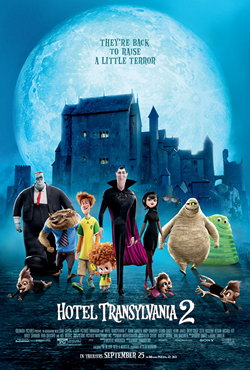
Hotel Transylvania 2
Year
2015
Overall
87.8
Est. Profit
$73,189,042
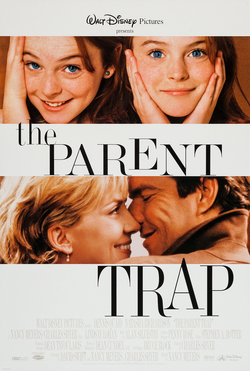
The Parent Trap
Year
1998
Overall
87.4
Est. Profit
$77,662,388
Turning Red
Year
2024
Overall
87.3
Est. Profit
$-191,490,851
 Elf
Elf