Screen Profits
Most Profitable Movies
Most Profitable Movies
Box Office Bombs
Movies Decade
Genres
Franchises
Actor Net Worth Rankings
Back to movie
Tournament (2017) Similar Movies
20 similar titles
Similar Movies
Turning Red
Year
2024
Overall
87.3
Est. Profit
$-191,490,851
Roadside Romeo
Year
2008
Overall
39.5
Est. Profit
$6,176,329
Aladdin
Year
1992
Overall
97.7
Est. Profit
$232,328,119
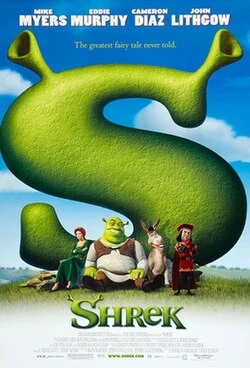
Shrek
Year
2001
Overall
95.9
Est. Profit
$196,186,888
Tangled
Year
2010
Overall
95.4
Est. Profit
$-31,230,687
Free Guy
Year
2021
Overall
94.9
Est. Profit
$13,777,950
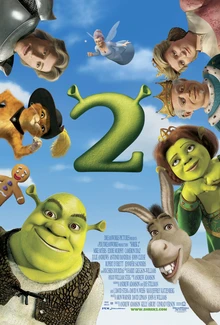
Shrek 2
Year
2004
Overall
94.7
Est. Profit
$264,427,567
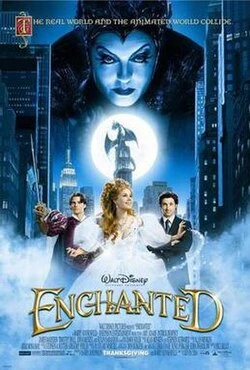
Enchanted
Year
2007
Overall
93.4
Est. Profit
$60,033,818
Aladdin
Year
2019
Overall
93.2
Est. Profit
$151,389,226
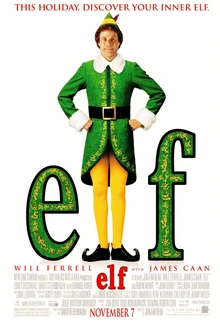
Elf
Year
2003
Overall
92.8
Est. Profit
$104,188,811
Elemental
Year
2023
Overall
91.6
Est. Profit
$-57,539,134
The Princess Bride
Year
1987
Overall
90.8
Est. Profit
$34,696,360
Happy Feet
Year
2006
Overall
90.8
Est. Profit
$63,605,370
Hercules
Year
1997
Overall
90.7
Est. Profit
$25,279,441
Horton Hears a Who!
Year
2008
Overall
90.4
Est. Profit
$27,161,307
Rio
Year
2011
Overall
90.3
Est. Profit
$60,468,140
Moonrise Kingdom
Year
2012
Overall
90.2
Est. Profit
$27,611,628
The Princess and the Frog
Year
2009
Overall
90.1
Est. Profit
$15,160,643
Shrek Forever After
Year
2010
Overall
89.2
Est. Profit
$41,746,312
Mary Poppins Returns
Year
2018
Overall
89.0
Est. Profit
$-49,432,801
 Turning Red