Synopsis
When their country is invaded and their families are taken, eight unlikely teenagers band together to fight.
Scores
Overall Score
67.6
Popularity Percentile (Year)
64.8%
Box Office Percentile (Year)
75.5%
Review Aggregate
60.0
Critic Consensus
Critic reception is mixed, with 62% of 58 logged reviews marked Fresh. Across reviews, critics repeatedly emphasize coming of age, thin plot, action-packed. Common reservations focus on thin plot, even when reviewers praise standout elements.
coming of agethin plotaction-packedemotionalsuspensefulrealisticgrittycharacter-drivenstylizedfamily-friendly
Cast
| Cast | Year | Reported Salary | Inflation Adjusted | Notes |
|---|---|---|---|---|
| Caitlin Stasey | 2012 | $1,432,000 | $1,956,000 | (est) |
| Rachel Hurd-Wood | 2012 | $881,000 | $1,204,000 | (est) |
| Lincoln Lewis | 2012 | $664,000 | $907,000 | (est) |
| Deniz Akdeniz | 2012 | $543,000 | $741,000 | (est) |
| Phoebe Tonkin | 2012 | $464,000 | $634,000 | (est) |
| Chris Pang | 2012 | $408,000 | $558,000 | (est) |
| Ashleigh Cummings | 2012 | $367,000 | $501,000 | (est) |
| Andy Ryan | 2012 | $334,000 | $456,000 | (est) |
| Colin Friels | 2012 | $308,000 | $420,000 | (est) |
Aggregated Reviews
Rotten Tomatoes critic score62.0
RT critic review count58
Rotten Tomatoes audience score57.0
RT audience rating count5,000
IMDb rating6.1
IMDb votes32,521
Box Office ?
| Category | Year | Reported | Inflation Adjusted |
|---|---|---|---|
| Domestic | 2012 | $4,936 | $6,744 |
| International | 2012 | $16,528,659 | $22,582,928 |
| Worldwide | 2012 | $16,533,595 | $22,589,672 |
Earnings / Profitability
| Category | Year | Reported | Inflation Adjusted |
|---|---|---|---|
| Revenues | |||
| Theatrical Net Revenue | 2012 | $6,613,932 | $9,036,543 |
| Digital Rentals ? | 2012 | $155,000 | $211,775 |
| Digital Purchases ? | 2012 | $70,000 | $95,640 |
| Physical Rentals ? | 2012 | $246,000 | $336,107 |
| Physical Purchases ? | 2012 | $609,000 | $832,070 |
| TV & Streaming Revenue | 2012 | $8,100,000 | $11,066,943 |
| Total Revenues | 2012 | $15,793,932 | $21,579,078 |
| Expenses | |||
| Budget ? | 2012 | $27,000,000 | $36,889,808 |
| Print & Advertising (P&A) ? | 2012 | $1,672,000 (est) | $2,284,436 (est) |
| Participations | 2012 | $316,000 | $431,747 |
| Residuals ? | 2012 | $453,000 | $618,929 |
| Interest & Overhead | 2012 | $4,590,000 | $6,271,267 |
| Total Expenses | 2012 | $34,031,000 | $46,496,188 |
| Movie Net Profit or Loss | 2012 | $-18,237,068 | $-24,917,110 |
Similar Movies
| Poster | Movie | Year | Match | Overall | Est. Profit |
|---|---|---|---|---|---|
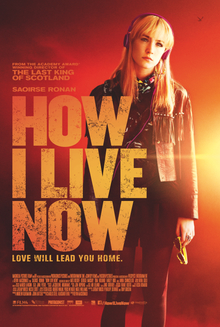 | How I Live Now | 2013 | Shared genres: 7 | 62.3 | $8,480,326 |
 | The Hunger Games: The Ballad of Songbirds & Snakes | 2023 | Shared genres: 6 | 90.2 | $11,235,826 |
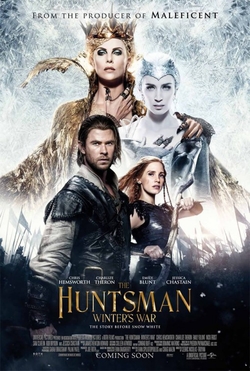 | The Huntsman: Winter's War | 2016 | Shared genres: 6 | 80.1 | $-71,553,698 |
 | The Host | 2013 | Shared genres: 6 | 75.3 | $-11,897,408 |
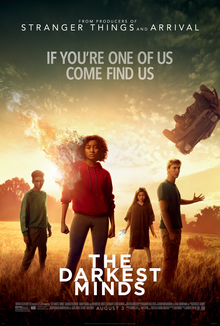 | The Darkest Minds | 2018 | Shared genres: 6 | 75.2 | $-23,822,513 |