Synopsis
Three vegetable friends seek the roots of true heroism during a 17th-century adventure.
Scores
Overall Score
64.1
Popularity Percentile (Year)
64.9%
Box Office Percentile (Year)
69.7%
Review Aggregate
52.5
Critic Consensus
Critic reception is mixed, with 45% of 33 logged reviews marked Fresh. Across reviews, critics repeatedly emphasize family-friendly, lighthearted, dark. Common reservations focus on execution consistency, even when reviewers praise standout elements.
family-friendlylighthearteddarkfunnystylizedcharacter-driven
Cast
| Cast | Year | Reported Salary | Inflation Adjusted | Notes |
|---|---|---|---|---|
| Phil Vischer | 2008 | $903,000 | $1,315,000 | (est) |
| Mike Nawrocki | 2008 | $556,000 | $810,000 | (est) |
| Laura Gerow | 2008 | $418,000 | $610,000 | (est) |
| Yuri Lowenthal | 2008 | $342,000 | $498,000 | (est) |
| Cam Clarke | 2008 | $293,000 | $426,000 | (est) |
| Alan Lee | 2008 | $258,000 | $375,000 | (est) |
| Tim Hodge | 2008 | $231,000 | $337,000 | (est) |
Aggregated Reviews
Rotten Tomatoes critic score43.0
RT critic review count35
Rotten Tomatoes audience score61.0
RT audience rating count50,000
IMDb rating5.6
IMDb votes3,236
Box Office ?
| Category | Year | Reported | Inflation Adjusted |
|---|---|---|---|
| Domestic | 2008 | $12,981,269 | $18,914,185 |
| International | 2008 | $266,456 | $388,236 |
| Worldwide | 2008 | $13,247,725 | $19,302,421 |
Earnings / Profitability
| Category | Year | Reported | Inflation Adjusted |
|---|---|---|---|
| Revenues | |||
| Theatrical Net Revenue | 2008 | $6,597,217 | $9,612,387 |
| Digital Rentals ? | 2008 | $1,322,000 | $1,926,203 |
| Digital Purchases ? | 2008 | $471,000 | $686,264 |
| Physical Rentals ? | 2008 | $10,954,000 | $15,960,380 |
| Physical Purchases ? | 2008 | $22,695,000 | $33,067,448 |
| TV & Streaming Revenue | 2008 | $3,115,505 | $4,539,404 |
| Total Revenues | 2008 | $45,154,721 | $65,792,086 |
| Expenses | |||
| Budget ? | 2008 | $15,000,000 | $21,855,550 |
| Print & Advertising (P&A) ? | 2008 | $8,718,000 (est) | $12,702,446 (est) |
| Participations | 2008 | $1,806,000 | $2,631,408 |
| Residuals ? | 2008 | $2,701,000 | $3,935,456 |
| Interest & Overhead | 2008 | $3,000,000 | $4,371,110 |
| Total Expenses | 2008 | $31,225,000 | $45,495,971 |
| Movie Net Profit or Loss | 2008 | $13,929,721 | $20,296,115 |
Similar Movies
| Poster | Movie | Year | Match | Overall | Est. Profit |
|---|---|---|---|---|---|
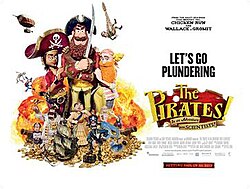 | The Pirates! Band of Misfits | 2012 | Shared genres: 8 | 79.4 | $-42,782,490 |
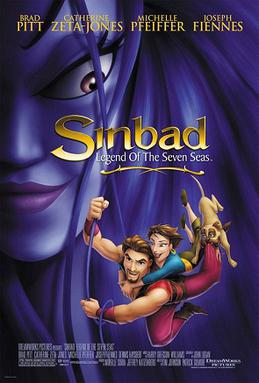 | Sinbad: Legend of the Seven Seas | 2003 | Shared genres: 8 | 76.9 | $-4,993,561 |
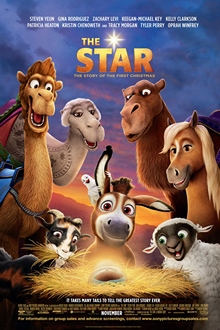 | The Star | 2017 | Shared genres: 8 | 69.7 | $6,054,678 |
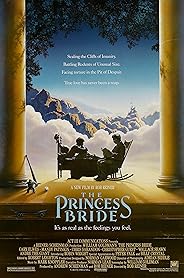 | The Princess Bride | 1987 | Shared genres: 7 | 90.8 | $34,696,360 |
 | Hook | 1991 | Shared genres: 7 | 89.3 | $58,180,762 |