Synopsis
King Louis XIV's quest for immortality leads him to capture and steal a mermaid's life force, a move that is further complicated by his illegitimate daughter's discovery of the creature.
Scores
Overall Score
55.7
Popularity Percentile (Year)
55.3%
Box Office Percentile (Year)
60.2%
Review Aggregate
49.0
Critic Consensus
Critic reception is largely negative, with 20% of 65 logged reviews marked Fresh. Across reviews, critics repeatedly emphasize thin plot, historical, romantic. Many reviews cite thin plot as the main reasons it falls short.
thin plothistoricalromanticfamily-friendlyvisually strikingrealisticfunnycoming of agedarkcharacter-driven
Cast
| Cast | Year | Reported Salary | Inflation Adjusted | Notes |
|---|---|---|---|---|
| Pierce Brosnan | 2022 | $3,130,000 | $3,354,000 | (est) |
| Kaya Scodelario | 2022 | $1,927,000 | $2,065,000 | (est) |
| Benjamin Walker | 2022 | $1,450,000 | $1,555,000 | (est) |
| William Hurt | 2022 | $1,186,000 | $1,271,000 | (est) |
| Rachel Griffiths | 2022 | $1,014,000 | $1,087,000 | (est) |
| Fan Bingbing | 2022 | $893,000 | $957,000 | (est) |
Aggregated Reviews
Rotten Tomatoes critic score20.0
RT critic review count65
Rotten Tomatoes audience score80.0
RT audience rating count100
IMDb rating5.2
IMDb votes6,891
Box Office ?
| Category | Year | Reported | Inflation Adjusted |
|---|---|---|---|
| Domestic | 2022 | $1,758,963 | $1,885,161 |
| International | 2022 | $472,484 | $506,383 |
| Worldwide | 2022 | $2,231,447 | $2,391,544 |
Earnings / Profitability
| Category | Year | Reported | Inflation Adjusted |
|---|---|---|---|
| Revenues | |||
| Theatrical Net Revenue | 2022 | $1,068,475 | $1,145,134 |
| Digital Rentals ? | 2022 | $3,888,000 | $4,166,948 |
| Digital Purchases ? | 2022 | $5,867,000 | $6,287,933 |
| Physical Rentals ? | 2022 | $1,057,000 | $1,132,835 |
| Physical Purchases ? | 2022 | $3,250,000 | $3,483,174 |
| TV & Streaming Revenue | 2022 | $703,585 | $754,064 |
| Total Revenues | 2022 | $15,834,060 | $16,970,088 |
| Expenses | |||
| Budget ? | 2022 | $40,000,000 | $42,869,833 |
| Print & Advertising (P&A) ? | 2022 | $2,120,000 (est) | $2,272,101 (est) |
| Participations | 2022 | $317,000 | $339,743 |
| Residuals ? | 2022 | $615,000 | $659,124 |
| Interest & Overhead | 2022 | $6,800,000 | $7,287,872 |
| Total Expenses | 2022 | $49,852,000 | $53,428,672 |
| Movie Net Profit or Loss | 2022 | $-34,017,940 | $-36,458,585 |
Similar Movies
| Poster | Movie | Year | Match | Overall | Est. Profit |
|---|---|---|---|---|---|
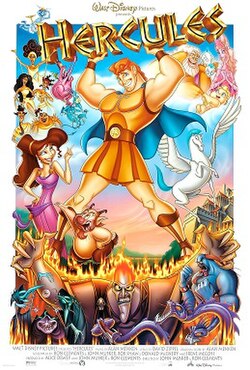 | Hercules | 1997 | Shared genres: 6 | 90.7 | $25,279,439 |
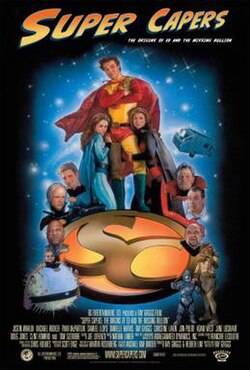 | Super Capers: The Origins of Ed and the Missing Bullion | 2009 | Shared genres: 6 | 18.5 | $6,194,478 |
 | Aladdin | 1992 | Shared genres: 5 | 97.7 | $232,328,117 |
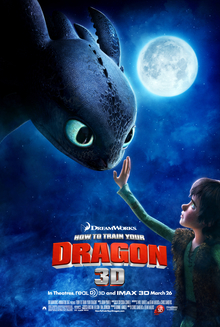 | How to Train Your Dragon | 2010 | Shared genres: 5 | 97.3 | $3,305,371 |
 | Shrek | 2001 | Shared genres: 5 | 95.9 | $196,186,888 |