Synopsis
A local Pennsylvania band scores a one-hit wonder in 1964 and rides the star-making machinery as long as they can, with lots of help from their manager.
Scores
Overall Score
82.5
Popularity Percentile (Year)
86.2%
Box Office Percentile (Year)
78.1%
Review Aggregate
82.0
Critic Consensus
Critic reception is mixed, with 93% of 58 logged reviews marked Fresh. Across reviews, critics repeatedly emphasize thin plot, lighthearted, historical. Common reservations focus on thin plot, even when reviewers praise standout elements.
thin plotlightheartedhistoricalstylizedsatiricalromanticcharacter-driven
Cast
| Cast | Year | Reported Salary | Inflation Adjusted | Notes |
|---|---|---|---|---|
| Tom Everett Scott | 1996 | $1,695,000 | $3,389,000 | (est) |
| Liv Tyler | 1996 | $1,044,000 | $2,086,000 | (est) |
| Johnathon Schaech | 1996 | $786,000 | $1,571,000 | (est) |
| Steve Zahn | 1996 | $642,000 | $1,284,000 | (est) |
| Ethan Embry | 1996 | $549,000 | $1,099,000 | (est) |
| Tom Hanks | 1996 | $484,000 | $967,000 | (est) |
Aggregated Reviews
Rotten Tomatoes critic score93.0
RT critic review count61
Rotten Tomatoes audience score78.0
RT audience rating count100,000
IMDb rating7.0
IMDb votes76,865
Box Office ?
| Category | Year | Reported | Inflation Adjusted |
|---|---|---|---|
| Domestic | 1996 | $25,857,416 | $51,698,352 |
| International | 1996 | N/A | N/A |
| Worldwide | 1996 | $25,857,688 | $51,698,896 |
Earnings / Profitability
| Category | Year | Reported | Inflation Adjusted |
|---|---|---|---|
| Revenues | |||
| Theatrical Net Revenue | 1996 | $12,928,708 | $25,849,176 |
| Digital Rentals ? | 1996 | N/A | N/A |
| Digital Purchases ? | 1996 | N/A | N/A |
| Physical Rentals ? | 1996 | $31,810,000 | $63,599,726 |
| Physical Purchases ? | 1996 | $37,687,000 | $75,349,981 |
| TV & Streaming Revenue | 1996 | $6,464,354 | $12,924,588 |
| Total Revenues | 1996 | $88,890,062 | $177,723,471 |
| Expenses | |||
| Budget ? | 1996 | $26,000,000 | $51,983,429 |
| Print & Advertising (P&A) ? | 1996 | $9,159,000 (est) | $18,312,163 (est) |
| Participations | 1996 | $7,111,000 | $14,217,468 |
| Residuals ? | 1996 | $5,444,000 | $10,884,530 |
| Interest & Overhead | 1996 | $4,420,000 | $8,837,183 |
| Total Expenses | 1996 | $52,134,000 | $104,234,773 |
| Movie Net Profit or Loss | 1996 | $36,756,062 | $73,488,698 |
Similar Movies
| Poster | Movie | Year | Match | Overall | Est. Profit |
|---|---|---|---|---|---|
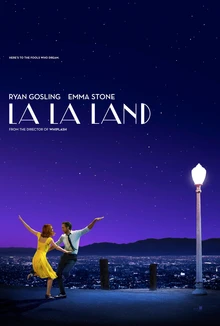 | La La Land | 2016 | Shared genres: 3 | 95.8 | $147,267,772 |
 | Green Book | 2018 | Shared genres: 3 | 95.1 | $93,303,120 |
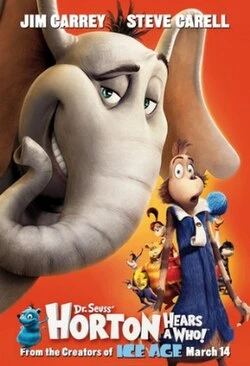 | Horton Hears a Who! | 2008 | Shared genres: 3 | 90.4 | $27,161,307 |
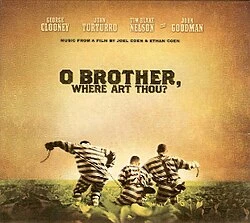 | O Brother, Where Art Thou? | 2000 | Shared genres: 3 | 89.3 | $32,137,327 |
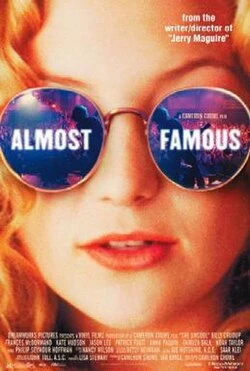 | Almost Famous | 2000 | Shared genres: 3 | 88.3 | $-11,860,327 |