Synopsis
After falling in love, three roommates experience changes in their lives.
Scores
Overall Score
64.4
Popularity Percentile (Year)
59.0%
Box Office Percentile (Year)
71.0%
Review Aggregate
65.0
Critic Consensus
Critic reception is mixed, with 50% of 2 logged reviews marked Fresh. Across reviews, critics repeatedly emphasize funny, character-driven, romantic. Common reservations focus on execution consistency, even when reviewers praise standout elements.
funnycharacter-drivenromanticemotionalvisually strikingthought-provoking
Cast
| Cast | Year | Reported Salary | Inflation Adjusted | Notes |
|---|---|---|---|---|
| Kartik Aaryan | 2015 | $0 | $0 | (est) |
| Divyendu Sharma | 2015 | $0 | $0 | (est) |
| Raayo S. Bakhirta | 2015 | $0 | $0 | (est) |
| Sonnalli Seygall | 2015 | $0 | $0 | (est) |
| Nushrat Bharucha | 2015 | $0 | $0 | (est) |
| Ishita Raj Sharma | 2015 | $0 | $0 | (est) |
Aggregated Reviews
Rotten Tomatoes critic scoreN/A
RT critic review count2
Rotten Tomatoes audience score60.0
RT audience rating count100
IMDb rating7.2
IMDb votes17,037
Box Office ?
| Category | Year | Reported | Inflation Adjusted |
|---|---|---|---|
| Domestic | 2015 | $222,856 | $294,979 |
| International | 2015 | $12,760,865 | $16,890,647 |
| Worldwide | 2015 | $12,983,721 | $17,185,626 |
Earnings / Profitability
| Category | Year | Reported | Inflation Adjusted |
|---|---|---|---|
| Revenues | |||
| Theatrical Net Revenue | 2015 | $5,215,774 | $6,903,748 |
| Digital Rentals ? | 2015 | $1,932,000 | $2,557,251 |
| Digital Purchases ? | 2015 | $2,026,000 | $2,681,672 |
| Physical Rentals ? | 2015 | $2,192,000 | $2,901,394 |
| Physical Purchases ? | 2015 | $5,874,000 | $7,774,995 |
| TV & Streaming Revenue | 2015 | $100,285 | $132,740 |
| Total Revenues | 2015 | $17,340,059 | $22,951,800 |
| Expenses | |||
| Budget ? | 2015 | $3 | $4 |
| Print & Advertising (P&A) ? source | 2015 | $2,808,000 | $3,716,749 |
| Participations | 2015 | $694,000 | $918,598 |
| Residuals ? | 2015 | $715,000 | $946,395 |
| Interest & Overhead | 2015 | $1 | $1 |
| Total Expenses | 2015 | $4,217,004 | $5,581,747 |
| Movie Net Profit or Loss | 2015 | $13,123,056 | $17,370,053 |
Similar Movies
| Poster | Movie | Year | Match | Overall | Est. Profit |
|---|---|---|---|---|---|
 | Big | 1988 | Shared genres: 3 | 95.9 | $84,885,694 |
 | La La Land | 2016 | Shared genres: 3 | 95.8 | $147,267,772 |
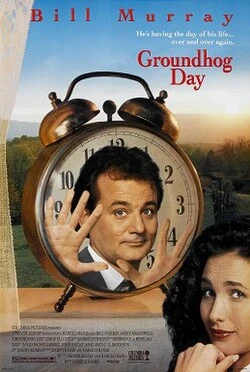 | Groundhog Day | 1993 | Shared genres: 3 | 95.4 | $78,676,441 |
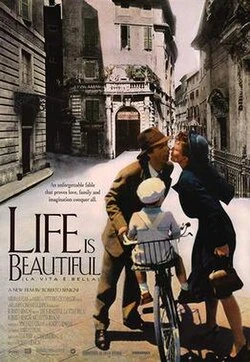 | Life Is Beautiful | 1998 | Shared genres: 3 | 95.2 | $112,743,538 |
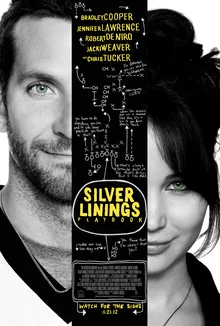 | Silver Linings Playbook | 2012 | Shared genres: 3 | 94.9 | $98,374,307 |