Synopsis
Five years after the events of Mamma Mia!, Sophie prepares for the grand reopening of the Hotel Bella Donna as she learns more about her mother's past.
Scores
Overall Score
89.8
Popularity Percentile (Year)
92.0%
Box Office Percentile (Year)
97.4%
Review Aggregate
71.6
Critic Consensus
Critic reception is largely positive, with 80% of 274 logged reviews marked Fresh. Across reviews, critics repeatedly emphasize thin plot, funny, lighthearted. Most critics frame the film as an effective delivery of its core style and intent.
thin plotfunnylightheartedemotionalvisually strikingromanticgrittystylizedchristmasfamily-friendly
Cast
| Cast | Year | Reported Salary | Inflation Adjusted | Notes |
|---|---|---|---|---|
| Christine Baranski | 2018 | $4,329,000 | $5,409,000 | (est) |
| Pierce Brosnan | 2018 | $2,665,000 | $3,329,000 | (est) |
| Dominic Cooper | 2018 | $2,006,000 | $2,507,000 | (est) |
| Colin Firth | 2018 | $1,640,000 | $2,049,000 | (est) |
| Andy Garcia | 2018 | $1,403,000 | $1,753,000 | (est) |
| Lily James | 2018 | $1,235,000 | $1,543,000 | (est) |
| Amanda Seyfried | 2018 | $1,109,000 | $1,385,000 | (est) |
| Stellan Skarsgård | 2018 | $1,010,000 | $1,262,000 | (est) |
| Julie Walters | 2018 | $930,000 | $1,162,000 | (est) |
| Cher | 2018 | $864,000 | $1,079,000 | (est) |
| Meryl Streep | 2018 | $808,000 | $1,010,000 | (est) |
Aggregated Reviews
Rotten Tomatoes critic score80.0
RT critic review count274
Rotten Tomatoes audience score66.0
RT audience rating count5,000
IMDb rating6.6
IMDb votes117,291
Box Office ?
| Category | Year | Reported | Inflation Adjusted |
|---|---|---|---|
| Domestic | 2018 | $120,634,936 | $150,709,597 |
| International | 2018 | $274,409,760 | $342,820,958 |
| Worldwide | 2018 | $395,044,700 | $493,530,560 |
Earnings / Profitability
| Category | Year | Reported | Inflation Adjusted |
|---|---|---|---|
| Revenues | |||
| Theatrical Net Revenue | 2018 | $170,081,372 | $212,483,182 |
| Digital Rentals ? | 2018 | $4,342,000 | $5,424,474 |
| Digital Purchases ? | 2018 | $5,235,000 | $6,540,102 |
| Physical Rentals ? | 2018 | $2,675,000 | $3,341,886 |
| Physical Purchases ? | 2018 | $7,587,000 | $9,478,462 |
| TV & Streaming Revenue | 2018 | $33,777,782 | $42,198,687 |
| Total Revenues | 2018 | $223,698,154 | $279,466,793 |
| Expenses | |||
| Budget ? | 2018 | $75,000,000 | $93,697,731 |
| Print & Advertising (P&A) ? | 2018 | $60,284,000 (est) | $75,312,987 (est) |
| Participations | 2018 | $17,896,000 | $22,357,528 |
| Residuals ? | 2018 | $2,656,000 | $3,318,149 |
| Interest & Overhead | 2018 | $11,250,000 | $14,054,660 |
| Total Expenses | 2018 | $167,086,000 | $208,741,054 |
| Movie Net Profit or Loss | 2018 | $56,612,154 | $70,725,738 |
Similar Movies
| Poster | Movie | Year | Match | Overall | Est. Profit |
|---|---|---|---|---|---|
 | Mamma Mia! | 2008 | Shared franchise (1) | 90.3 | $174,382,596 |
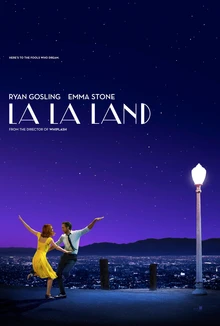 | La La Land | 2016 | Shared genres: 4 | 95.8 | $147,267,772 |
 | Aladdin | 2019 | Shared genres: 4 | 93.2 | $151,389,226 |
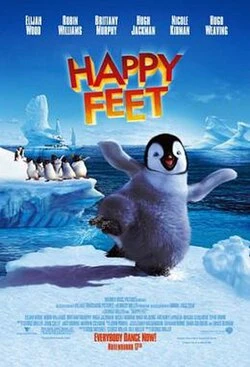 | Happy Feet | 2006 | Shared genres: 4 | 90.8 | $63,605,370 |
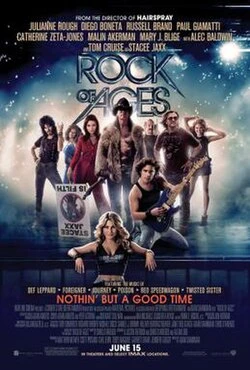 | Rock of Ages | 2012 | Shared genres: 4 | 78.5 | $-62,679,041 |