Synopsis
Two professors team up to locate a lost treasure and embark on an adventure that takes them from a Tibetan ice cave to Dubai, and to a mountain temple in India.
Scores
Overall Score
69.4
Popularity Percentile (Year)
60.5%
Box Office Percentile (Year)
94.8%
Review Aggregate
45.2
Critic Consensus
Critic reception is mixed, with 48% of 23 logged reviews marked Fresh. Across reviews, critics repeatedly emphasize funny, visually striking, suspenseful. Common reservations focus on execution consistency, even when reviewers praise standout elements.
funnyvisually strikingsuspensefulfamily-friendlyaction-packedstylized
Cast
| Cast | Year | Reported Salary | Inflation Adjusted | Notes |
|---|---|---|---|---|
| Jackie Chan | 2017 | $5,086,000 | $6,509,000 | (est) |
| Aarif Rahman | 2017 | $3,131,000 | $4,007,000 | (est) |
| Lay Zhang | 2017 | $2,357,000 | $3,017,000 | (est) |
| Disha Patani | 2017 | $1,927,000 | $2,467,000 | (est) |
| Miya Muqi | 2017 | $1,648,000 | $2,110,000 | (est) |
| Sonu Sood | 2017 | $1,451,000 | $1,857,000 | (est) |
Aggregated Reviews
Rotten Tomatoes critic score48.0
RT critic review count23
Rotten Tomatoes audience score37.0
RT audience rating count50
IMDb rating5.2
IMDb votes12,021
Box Office ?
| Category | Year | Reported | Inflation Adjusted |
|---|---|---|---|
| Domestic | 2017 | $362,657 | $464,160 |
| International | 2017 | $257,380,359 | $329,417,457 |
| Worldwide | 2017 | $257,743,016 | $329,881,616 |
Earnings / Profitability
| Category | Year | Reported | Inflation Adjusted |
|---|---|---|---|
| Revenues | |||
| Theatrical Net Revenue | 2017 | $103,133,472 | $131,999,062 |
| Digital Rentals ? | 2017 | $2,222,000 | $2,843,906 |
| Digital Purchases ? | 2017 | $2,479,000 | $3,172,837 |
| Physical Rentals ? | 2017 | $1,657,000 | $2,120,771 |
| Physical Purchases ? | 2017 | $4,759,000 | $6,090,976 |
| TV & Streaming Revenue | 2017 | $163,196 | $208,872 |
| Total Revenues | 2017 | $114,413,668 | $146,436,424 |
| Expenses | |||
| Budget ? | 2017 | $65,000,000 | $83,192,574 |
| Print & Advertising (P&A) ? | 2017 | $11,355,000 (est) | $14,533,103 (est) |
| Participations | 2017 | $9,153,000 | $11,714,794 |
| Residuals ? | 2017 | $616,000 | $788,410 |
| Interest & Overhead | 2017 | $9,750,000 | $12,478,886 |
| Total Expenses | 2017 | $95,874,000 | $122,707,767 |
| Movie Net Profit or Loss | 2017 | $18,539,668 | $23,728,657 |
Similar Movies
| Poster | Movie | Year | Match | Overall | Est. Profit |
|---|---|---|---|---|---|
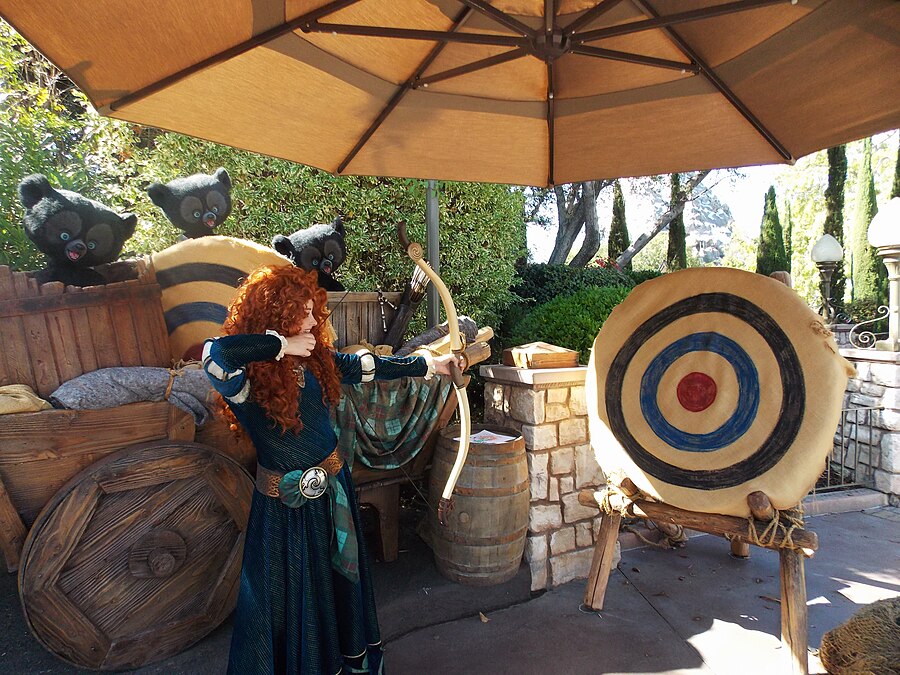 | Brave | 2012 | Shared genres: 6 | 93.2 | $-7,895,099 |
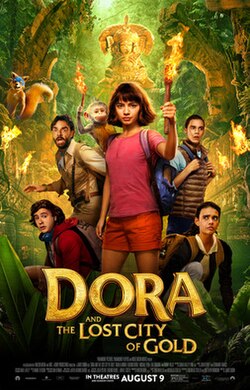 | Dora and the Lost City of Gold | 2019 | Shared genres: 6 | 84.6 | $-22,022,877 |
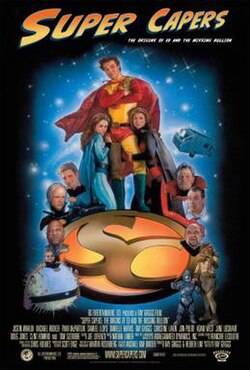 | Super Capers: The Origins of Ed and the Missing Bullion | 2009 | Shared genres: 6 | 18.5 | $6,194,478 |
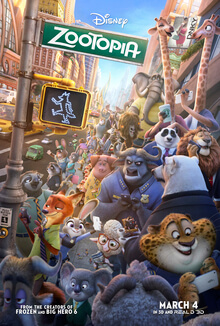 | Zootopia | 2016 | Shared genres: 5 | 97.5 | $187,584,390 |
 | Spirited Away | 2002 | Shared genres: 5 | 97.1 | $91,868,030 |