Synopsis
Explore the world to see how it intersects with the stories related in Genesis. Del Tackett of "The Truth Project" hikes through canyons, climbs mountains, and dives below the sea to examine two competing views - one compelling truth.
Scores
Overall Score
43.2
Popularity Percentile (Year)
31.9%
Box Office Percentile (Year)
59.1%
Review Aggregate
41.0
Critic Consensus
No professional critic quote data was available to synthesize a consensus summary.
No tags
Cast
| Cast | Year | Reported Salary | Inflation Adjusted | Notes |
|---|---|---|---|---|
| George Grant | 2017 | $33,000 | $42,000 | (est) |
| Paul Nelson | 2017 | $20,000 | $26,000 | (est) |
| Marcus R. Ross | 2017 | $15,000 | $19,000 | (est) |
| Andrew A. Snelling | 2017 | $12,000 | $16,000 | (est) |
| Kurt Wise | 2017 | $11,000 | $13,000 | (est) |
Aggregated Reviews
Rotten Tomatoes critic scoreN/A
RT critic review count0
Rotten Tomatoes audience scoreN/A
RT audience rating count25
IMDb rating4.1
IMDb votes1,895
Box Office ?
| Category | Year | Reported | Inflation Adjusted |
|---|---|---|---|
| Domestic | 2017 | $2,570,392 | $3,289,808 |
| International | 2017 | N/A | N/A |
| Worldwide | 2017 | $2,570,392 | $3,289,808 |
Earnings / Profitability
| Category | Year | Reported | Inflation Adjusted |
|---|---|---|---|
| Revenues | |||
| Theatrical Net Revenue | 2017 | $1,285,196 | $1,644,904 |
| Digital Rentals ? | 2017 | $2,767,000 | $3,541,444 |
| Digital Purchases ? | 2017 | $3,087,000 | $3,951,007 |
| Physical Rentals ? | 2017 | $2,064,000 | $2,641,684 |
| Physical Purchases ? | 2017 | $5,927,000 | $7,585,883 |
| TV & Streaming Revenue | 2017 | $1,028,157 | $1,315,923 |
| Total Revenues | 2017 | $16,158,353 | $20,680,845 |
| Expenses | |||
| Budget ? | 2017 | $535,000 (est) | $684,739 (est) |
| Print & Advertising (P&A) ? | 2017 | $582,000 (est) | $744,893 (est) |
| Participations | 2017 | $646,000 | $826,806 |
| Residuals ? | 2017 | $809,000 | $1,035,428 |
| Interest & Overhead | 2017 | $107,000 | $136,948 |
| Total Expenses | 2017 | $2,679,000 | $3,428,814 |
| Movie Net Profit or Loss | 2017 | $13,479,353 | $17,252,031 |
Similar Movies
| Poster | Movie | Year | Match | Overall | Est. Profit |
|---|---|---|---|---|---|
 | What the #$*! Do We (K)now!? | 2004 | Shared genres: 2 | 62.9 | $41,656,455 |
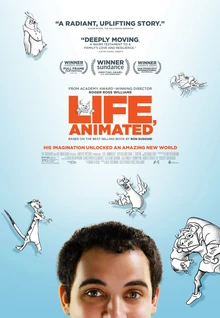 | Life, Animated | 2016 | Shared genres: 2 | 54.7 | $9,639,529 |
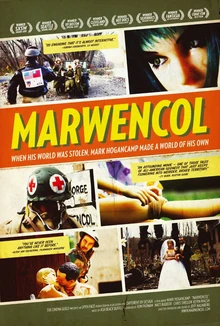 | Marwencol | 2010 | Shared genres: 2 | 45.1 | $11,945,436 |
 | The Lord of the Rings: The Two Towers | 2002 | Shared genres: 1 | 98.6 | $353,999,551 |
 | The Lord of the Rings: The Fellowship of the Ring | 2001 | Shared genres: 1 | 98.2 | $290,786,010 |