Synopsis
When Scrat's acorn sends an asteroid to Earth, the Herd must find a way to stop the asteroid from hitting Earth with the help of a returning friend.
Scores
Overall Score
79.2
Popularity Percentile (Year)
84.7%
Box Office Percentile (Year)
97.4%
Review Aggregate
35.1
Critic Consensus
Critic reception is mixed, with 18% of 120 logged reviews marked Fresh. Across reviews, critics repeatedly emphasize family-friendly, funny, coming of age. Common reservations focus on execution consistency, even when reviewers praise standout elements.
family-friendlyfunnycoming of agesurrealgrittylightheartedstylizedvisually striking
Cast
| Cast | Year | Reported Salary | Inflation Adjusted | Notes |
|---|---|---|---|---|
| Ray Romano | 2016 | $8,856,000 | $11,576,000 | (est) |
| John Leguizamo | 2016 | $5,452,000 | $7,126,000 | (est) |
| Denis Leary | 2016 | $4,105,000 | $5,365,000 | (est) |
| Josh Peck | 2016 | $3,356,000 | $4,386,000 | (est) |
| Simon Pegg | 2016 | $2,871,000 | $3,752,000 | (est) |
| Seann William Scott | 2016 | $2,527,000 | $3,303,000 | (est) |
| Jennifer Lopez | 2016 | $2,268,000 | $2,965,000 | (est) |
| Queen Latifah | 2016 | $2,066,000 | $2,700,000 | (est) |
Aggregated Reviews
Rotten Tomatoes critic score18.0
RT critic review count120
Rotten Tomatoes audience score39.0
RT audience rating count25,000
IMDb rating5.7
IMDb votes82,571
Box Office ?
| Category | Year | Reported | Inflation Adjusted |
|---|---|---|---|
| Domestic | 2016 | $64,063,008 | $83,735,690 |
| International | 2016 | $344,516,030 | $450,311,161 |
| Worldwide | 2016 | $408,579,038 | $534,046,851 |
Earnings / Profitability
| Category | Year | Reported | Inflation Adjusted |
|---|---|---|---|
| Revenues | |||
| Theatrical Net Revenue | 2016 | $169,837,916 | $221,992,309 |
| Digital Rentals ? | 2016 | $4,443,000 | $5,807,371 |
| Digital Purchases ? | 2016 | $4,529,000 | $5,919,780 |
| Physical Rentals ? | 2016 | $3,900,000 | $5,097,625 |
| Physical Purchases ? | 2016 | $11,007,000 | $14,387,066 |
| TV & Streaming Revenue | 2016 | $16,015,752 | $20,933,923 |
| Total Revenues | 2016 | $209,732,668 | $274,138,075 |
| Expenses | |||
| Budget ? | 2016 | $105,000,000 | $137,243,750 |
| Print & Advertising (P&A) ? | 2016 | $98,463,000 (est) | $128,699,346 (est) |
| Participations | 2016 | $4,195,000 | $5,483,215 |
| Residuals ? | 2016 | $2,141,000 | $2,798,465 |
| Interest & Overhead | 2016 | $12,600,000 | $16,469,250 |
| Total Expenses | 2016 | $222,399,000 | $290,694,026 |
| Movie Net Profit or Loss | 2016 | $-12,666,332 | $-16,555,951 |
Similar Movies
| Poster | Movie | Year | Match | Overall | Est. Profit |
|---|---|---|---|---|---|
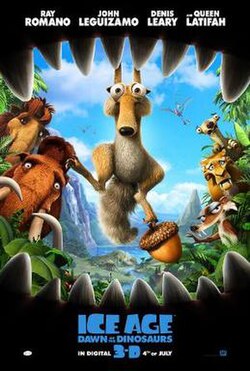 | Ice Age: Dawn of the Dinosaurs | 2009 | Shared franchise (1) | 89.0 | $202,536,735 |
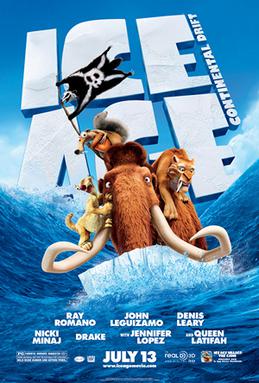 | Ice Age: Continental Drift | 2012 | Shared franchise (1) | 86.7 | $181,432,213 |
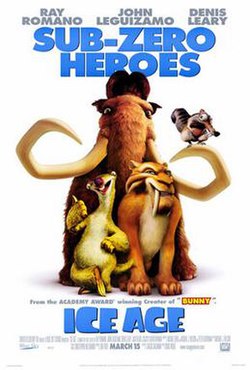 | Ice Age | 2002 | Shared franchise (1) | 93.7 | $120,301,068 |
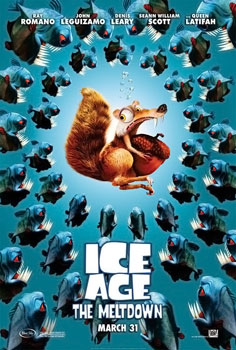 | Ice Age 2: The Meltdown | 2006 | Shared franchise (1) | 90.7 | $142,859,138 |
 | Incredibles 2 | 2018 | Shared genres: 7 | 96.0 | $281,129,928 |