Synopsis
Mortal hero Bek teams with the god Horus in an alliance against Set, the merciless god of darkness, who has usurped Egypt's throne, plunging the once peaceful and prosperous empire into chaos and conflict.
Scores
Overall Score
78.8
Popularity Percentile (Year)
89.1%
Box Office Percentile (Year)
92.1%
Review Aggregate
32.5
Critic Consensus
Critic reception is largely negative, with 15% of 193 logged reviews marked Fresh. Across reviews, critics repeatedly emphasize thin plot, visually striking, funny. Many reviews cite thin plot as the main reasons it falls short.
thin plotvisually strikingfunnystylizedcharacter-drivensuspensefulfamily-friendlygrittychristmasnoir
Cast
| Cast | Year | Reported Salary | Inflation Adjusted | Notes |
|---|---|---|---|---|
| Nikolaj Coster-Waldau | 2016 | $11,136,000 | $14,556,000 | (est) |
| Brenton Thwaites | 2016 | $6,855,000 | $8,960,000 | (est) |
| Chadwick Boseman | 2016 | $5,161,000 | $6,746,000 | (est) |
| Élodie Yung | 2016 | $4,220,000 | $5,516,000 | (est) |
| Courtney Eaton | 2016 | $3,610,000 | $4,718,000 | (est) |
| Rufus Sewell | 2016 | $3,177,000 | $4,153,000 | (est) |
| Gerard Butler | 2016 | $2,852,000 | $3,728,000 | (est) |
| Geoffrey Rush | 2016 | $2,598,000 | $3,395,000 | (est) |
| Bryan Brown | 2016 | $2,392,000 | $3,127,000 | (est) |
Aggregated Reviews
Rotten Tomatoes critic score15.0
RT critic review count193
Rotten Tomatoes audience score37.0
RT audience rating count25,000
IMDb rating5.4
IMDb votes133,011
Box Office ?
| Category | Year | Reported | Inflation Adjusted |
|---|---|---|---|
| Domestic | 2016 | $31,153,464 | $40,720,175 |
| International | 2016 | $119,527,400 | $156,232,280 |
| Worldwide | 2016 | $150,680,860 | $196,952,450 |
Earnings / Profitability
| Category | Year | Reported | Inflation Adjusted |
|---|---|---|---|
| Revenues | |||
| Theatrical Net Revenue | 2016 | $63,387,692 | $82,853,000 |
| Digital Rentals ? | 2016 | $4,188,000 | $5,474,065 |
| Digital Purchases ? | 2016 | $4,269,000 | $5,579,939 |
| Physical Rentals ? | 2016 | $3,676,000 | $4,804,839 |
| Physical Purchases ? | 2016 | $10,374,000 | $13,559,683 |
| TV & Streaming Revenue | 2016 | $7,788,366 | $10,180,044 |
| Total Revenues | 2016 | $93,683,058 | $122,451,569 |
| Expenses | |||
| Budget ? | 2016 | $140,000,000 | $182,991,675 |
| Print & Advertising (P&A) ? | 2016 | $35,675,000 (est) | $46,630,200 (est) |
| Participations | 2016 | $1,874,000 | $2,449,474 |
| Residuals ? | 2016 | $1,667,000 | $2,178,908 |
| Interest & Overhead | 2016 | $16,800,000 | $21,959,001 |
| Total Expenses | 2016 | $196,016,000 | $256,209,259 |
| Movie Net Profit or Loss | 2016 | $-102,332,942 | $-133,757,689 |
Similar Movies
| Poster | Movie | Year | Match | Overall | Est. Profit |
|---|---|---|---|---|---|
 | Rise of the Guardians | 2012 | Shared genres: 7 | 90.1 | $-100,877,866 |
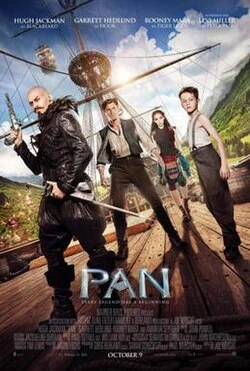 | Pan | 2015 | Shared genres: 7 | 79.4 | $-138,875,760 |
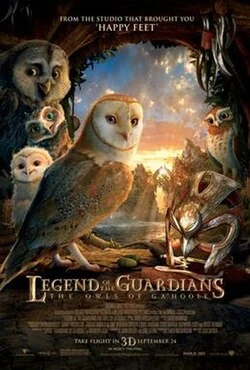 | Legend of the Guardians: The Owls of Ga'Hoole | 2010 | Shared genres: 7 | 78.5 | $-29,816,284 |
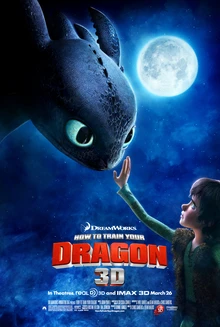 | How to Train Your Dragon | 2010 | Shared genres: 6 | 97.3 | $3,305,375 |
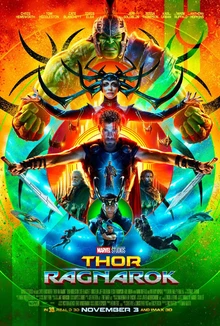 | Thor: Ragnarok | 2017 | Shared genres: 6 | 97.1 | $78,916,095 |