Synopsis
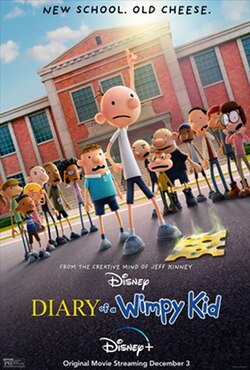
A Heffley family road trip to attend Meemaw's 90th birthday party goes hilariously off course thanks to Greg's newest scheme to get to a video gaming convention.
Scores
Overall Score
64.3
Popularity Percentile (Year)
66.0%
Box Office Percentile (Year)
82.5%
Review Aggregate
28.5
Critic Consensus
Critic reception is mixed, with 19% of 69 logged reviews marked Fresh. Across reviews, critics repeatedly emphasize family-friendly, funny, lighthearted. Common reservations focus on execution consistency, even when reviewers praise standout elements.
family-friendlyfunnylightheartedcoming of agegrittycharacter-driven
Cast
| Cast | Year | Reported Salary | Inflation Adjusted | Notes |
|---|---|---|---|---|
| Jason Drucker | 2017 | $1,582,000 | $2,024,000 | (est) |
| Alicia Silverstone | 2017 | $974,000 | $1,246,000 | (est) |
| Tom Everett Scott | 2017 | $733,000 | $938,000 | (est) |
| Charlie Wright | 2017 | $599,000 | $767,000 | (est) |
| Owen Asztalos | 2017 | $513,000 | $656,000 | (est) |
Aggregated Reviews
Rotten Tomatoes critic score19.0
RT critic review count69
Rotten Tomatoes audience score29.0
RT audience rating count5,000
IMDb rating4.3
IMDb votes12,174
Box Office ?
| Category | Year | Reported | Inflation Adjusted |
|---|---|---|---|
| Domestic | 2017 | $20,738,724 | $26,543,198 |
| International | 2017 | $19,402,248 | $24,832,661 |
| Worldwide | 2017 | $40,140,972 | $51,375,858 |
Earnings / Profitability
| Category | Year | Reported | Inflation Adjusted |
|---|---|---|---|
| Revenues | |||
| Theatrical Net Revenue | 2017 | $18,130,261 | $23,204,663 |
| Digital Rentals ? | 2017 | $3,708,000 | $4,745,816 |
| Digital Purchases ? | 2017 | $4,138,000 | $5,296,167 |
| Physical Rentals ? | 2017 | $2,766,000 | $3,540,164 |
| Physical Purchases ? | 2017 | $7,945,000 | $10,168,692 |
| TV & Streaming Revenue | 2017 | $4,977,294 | $6,370,367 |
| Total Revenues | 2017 | $41,664,555 | $53,325,871 |
| Expenses | |||
| Budget ? | 2017 | $22,000,000 | $28,157,487 |
| Print & Advertising (P&A) ? | 2017 | $19,681,000 (est) | $25,189,432 (est) |
| Participations | 2017 | $833,000 | $1,066,145 |
| Residuals ? | 2017 | $1,260,000 | $1,612,656 |
| Interest & Overhead | 2017 | $4,400,000 | $5,631,497 |
| Total Expenses | 2017 | $48,174,000 | $61,657,217 |
| Movie Net Profit or Loss | 2017 | $-6,509,445 | $-8,331,346 |
Similar Movies
| Poster | Movie | Year | Match | Overall | Est. Profit |
|---|---|---|---|---|---|
 | Diary of a Wimpy Kid | 2010 | Shared franchise (1) | 76.5 | $48,993,884 |
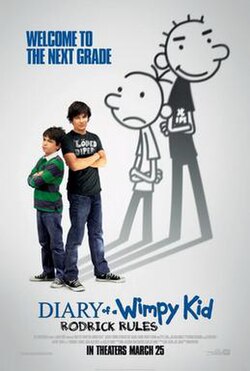 | Diary of a Wimpy Kid: Rodrick Rules | 2011 | Shared franchise (1) | 72.7 | $21,127,286 |
 | Diary of a Wimpy Kid: Dog Days | 2012 | Shared franchise (1) | 70.9 | $18,822,910 |
 | Shrek | 2001 | Shared genres: 6 | 95.9 | $196,186,888 |
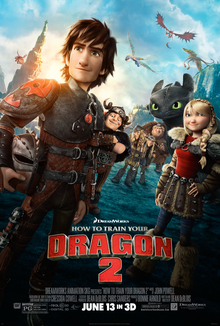 | How to Train Your Dragon 2 | 2014 | Shared genres: 6 | 95.1 | $48,707,119 |