Synopsis
Caesar, an effete tough guy and his slovenly half brother, Otto, have signed up as summer camp counselors. But when the mysterious Carrie shows up, the other counselors start disappearing one by one.
Scores
Overall Score
13.5
Popularity Percentile (Year)
4.2%
Box Office Percentile (Year)
13.8%
Review Aggregate
34.0
Critic Consensus
No professional critic quote data was available to synthesize a consensus summary.
No tags
Cast
| Cast | Year | Reported Salary | Inflation Adjusted | Notes |
|---|---|---|---|---|
| Dave Campfield | 2011 | $0 | $0 | (est) |
| Paul Chomicki | 2011 | $0 | $0 | (est) |
| Felissa Rose | 2011 | $0 | $0 | (est) |
| Deron Miller | 2011 | $0 | $0 | (est) |
| Joe Estevez | 2011 | $0 | $0 | (est) |
| Brinke Stevens | 2011 | $0 | $0 | (est) |
Aggregated Reviews
Rotten Tomatoes critic scoreN/A
RT critic review count0
Rotten Tomatoes audience scoreN/A
RT audience rating count25
IMDb rating3.4
IMDb votes288
Box Office ?
| Category | Year | Reported | Inflation Adjusted |
|---|---|---|---|
| Domestic | 2011 | $25,844 | $36,048 |
| International | 2011 | N/A | N/A |
| Worldwide | 2011 | $25,844 | $36,048 |
Earnings / Profitability
| Category | Year | Reported | Inflation Adjusted |
|---|---|---|---|
| Revenues | |||
| Theatrical Net Revenue | 2011 | $12,922 | $18,024 |
| Digital Rentals ? | 2011 | $579,000 | $807,614 |
| Digital Purchases ? | 2011 | $186,000 | $259,441 |
| Physical Rentals ? | 2011 | $1,060,000 | $1,478,533 |
| Physical Purchases ? | 2011 | $2,527,000 | $3,524,766 |
| TV & Streaming Revenue | 2011 | $75,000 | $104,613 |
| Total Revenues | 2011 | $4,439,922 | $6,192,990 |
| Expenses | |||
| Budget ? | 2011 | $250,000 (est) | $348,711 (est) |
| Print & Advertising (P&A) ? | 2011 | $80,000 (est) | $111,587 (est) |
| Participations | 2011 | $178,000 | $248,282 |
| Residuals ? | 2011 | $291,000 | $405,899 |
| Interest & Overhead | 2011 | $50,000 | $69,742 |
| Total Expenses | 2011 | $849,000 | $1,184,221 |
| Movie Net Profit or Loss | 2011 | $3,590,922 | $5,008,769 |
Similar Movies
| Poster | Movie | Year | Match | Overall | Est. Profit |
|---|---|---|---|---|---|
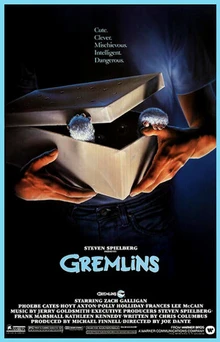 | Gremlins | 1984 | Shared genres: 3 | 93.6 | $106,400,153 |
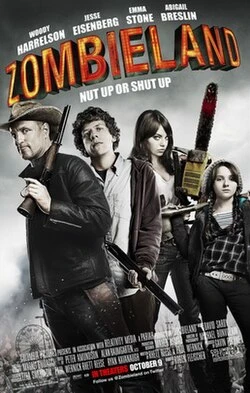 | Zombieland | 2009 | Shared genres: 3 | 92.3 | $47,905,435 |
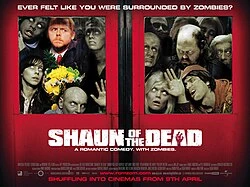 | Shaun of the Dead | 2004 | Shared genres: 3 | 89.7 | $44,643,639 |
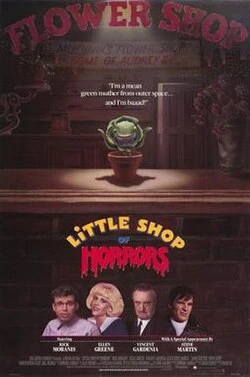 | Little Shop of Horrors | 1986 | Shared genres: 3 | 87.5 | $21,495,297 |
 | Goosebumps | 2015 | Shared genres: 3 | 86.4 | $-26,033,488 |