Synopsis
Jim, Michelle, Stifler, and their friends reunite in East Great Falls, Michigan for their high school reunion.
Scores
Overall Score
87.3
Popularity Percentile (Year)
95.1%
Box Office Percentile (Year)
94.6%
Review Aggregate
56.8
Critic Consensus
Critic reception is mixed, with 45% of 184 logged reviews marked Fresh. Across reviews, critics repeatedly emphasize funny, thin plot, lighthearted. Common reservations focus on thin plot, even when reviewers praise standout elements.
funnythin plotlightheartedcoming of ageupliftingromanticcharacter-drivenemotionalgritty
Cast
| Cast | Year | Reported Salary | Inflation Adjusted | Notes |
|---|---|---|---|---|
| Jason Biggs | 2012 | $3,022,000 | $4,129,000 | (est) |
| Alyson Hannigan | 2012 | $1,860,000 | $2,542,000 | (est) |
| Chris Klein | 2012 | $600,000 source | $819,774 | reported |
| Thomas Ian Nicholas | 2012 | $500,000 source | $683,145 | reported |
| Tara Reid | 2012 | $979,000 | $1,338,000 | (est) |
| Seann William Scott | 2012 | $862,000 | $1,178,000 | (est) |
| Mena Suvari | 2012 | $750,000 source | $1,024,717 | reported |
| Eddie Kaye Thomas | 2012 | $705,000 | $963,000 | (est) |
| Jennifer Coolidge | 2012 | $625,000 source | $853,931 | reported |
| Eugene Levy | 2012 | $603,000 | $824,000 | (est) |
Aggregated Reviews
Rotten Tomatoes critic score45.0
RT critic review count184
Rotten Tomatoes audience score63.0
RT audience rating count250,000
IMDb rating6.7
IMDb votes231,002
Box Office ?
| Category | Year | Reported | Inflation Adjusted |
|---|---|---|---|
| Domestic | 2012 | $57,011,520 | $77,894,228 |
| International | 2012 | $177,978,060 | $243,169,512 |
| Worldwide | 2012 | $234,989,580 | $321,063,740 |
Earnings / Profitability
| Category | Year | Reported | Inflation Adjusted |
|---|---|---|---|
| Revenues | |||
| Theatrical Net Revenue | 2012 | $99,696,984 | $136,214,919 |
| Digital Rentals ? | 2012 | $4,824,000 | $6,590,979 |
| Digital Purchases ? | 2012 | $2,169,000 | $2,963,481 |
| Physical Rentals ? | 2012 | $7,646,000 | $10,446,648 |
| Physical Purchases ? | 2012 | $18,890,000 | $25,809,204 |
| TV & Streaming Revenue | 2012 | $14,252,880 | $19,473,557 |
| Total Revenues | 2012 | $147,478,864 | $201,498,788 |
| Expenses | |||
| Budget ? | 2012 | $50,000,000 | $68,314,463 |
| Print & Advertising (P&A) ? | 2012 | $33,728,000 (est) | $46,082,204 (est) |
| Participations | 2012 | $11,798,000 | $16,119,481 |
| Residuals ? | 2012 | $2,902,000 | $3,964,971 |
| Interest & Overhead | 2012 | $7,500,000 | $10,247,169 |
| Total Expenses | 2012 | $105,928,000 | $144,728,289 |
| Movie Net Profit or Loss | 2012 | $41,550,864 | $56,770,499 |
Similar Movies
| Poster | Movie | Year | Match | Overall | Est. Profit |
|---|---|---|---|---|---|
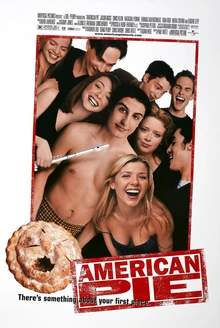 | American Pie | 1999 | Shared franchise (1) | 90.5 | $138,044,388 |
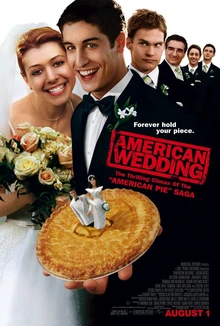 | American Wedding | 2003 | Shared franchise (1) | 87.9 | $83,747,915 |
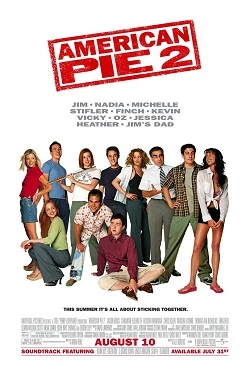 | American Pie 2 | 2001 | Shared franchise (1) | 87.7 | $139,099,808 |
 | Toy Story 3 | 2010 | Shared genres: 1 | 98.0 | $216,158,051 |
 | Toy Story | 1995 | Shared genres: 1 | 97.9 | $171,576,210 |