Synopsis
Alexander's day begins with gum stuck in his hair, followed by more calamities. However, he finds little sympathy from his family and begins to wonder if bad things only happen to him, his mom, dad, brother and sister - who all find themselves living through their own terrible, horrible, no good, very bad day.
Scores
Overall Score
78.7
Popularity Percentile (Year)
77.9%
Box Office Percentile (Year)
90.1%
Review Aggregate
60.6
Critic Consensus
Critic reception is mixed, with 62% of 119 logged reviews marked Fresh. Across reviews, critics repeatedly emphasize family-friendly, funny, thin plot. Common reservations focus on thin plot, even when reviewers praise standout elements.
family-friendlyfunnythin plotlightheartedcharacter-drivencoming of agethought-provoking
Cast
| Cast | Year | Reported Salary | Inflation Adjusted | Notes |
|---|---|---|---|---|
| Steve Carell | 2014 | $2,694,000 | $3,570,000 | (est) |
| Jennifer Garner | 2014 | $1,658,000 | $2,197,000 | (est) |
| Ed Oxenbould | 2014 | $1,248,000 | $1,654,000 | (est) |
Aggregated Reviews
Rotten Tomatoes critic score62.0
RT critic review count119
Rotten Tomatoes audience score58.0
RT audience rating count25,000
IMDb rating6.2
IMDb votes48,285
Box Office ?
| Category | Year | Reported | Inflation Adjusted |
|---|---|---|---|
| Domestic | 2014 | $66,954,148 | $88,734,752 |
| International | 2014 | $33,700,000 | $44,662,821 |
| Worldwide | 2014 | $100,654,150 | $133,397,576 |
Earnings / Profitability
| Category | Year | Reported | Inflation Adjusted |
|---|---|---|---|
| Revenues | |||
| Theatrical Net Revenue | 2014 | $46,957,074 | $62,232,505 |
| Digital Rentals ? | 2014 | $4,518,000 | $5,987,734 |
| Digital Purchases ? | 2014 | $3,579,000 | $4,743,271 |
| Physical Rentals ? | 2014 | $5,151,000 | $6,826,653 |
| Physical Purchases ? | 2014 | $13,884,000 | $18,400,552 |
| TV & Streaming Revenue | 2014 | $16,738,537 | $22,183,688 |
| Total Revenues | 2014 | $90,827,611 | $120,374,402 |
| Expenses | |||
| Budget ? | 2014 | $28,000,000 | $37,108,576 |
| Print & Advertising (P&A) ? | 2014 | $35,000,000 (est) | $46,385,719 (est) |
| Participations | 2014 | $3,633,000 | $4,814,838 |
| Residuals ? | 2014 | $2,471,000 | $3,274,832 |
| Interest & Overhead | 2014 | $4,760,000 | $6,308,458 |
| Total Expenses | 2014 | $73,864,000 | $97,892,422 |
| Movie Net Profit or Loss | 2014 | $16,963,611 | $22,481,980 |
Similar Movies
| Poster | Movie | Year | Match | Overall | Est. Profit |
|---|---|---|---|---|---|
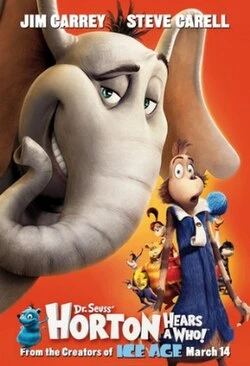 | Horton Hears a Who! | 2008 | Shared genres: 7 | 90.4 | $27,161,307 |
 | Rise of the Guardians | 2012 | Shared genres: 7 | 90.1 | $-100,877,866 |
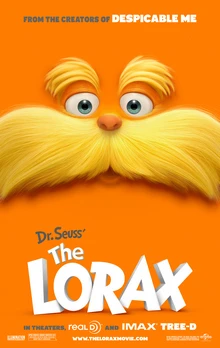 | The Lorax | 2012 | Shared genres: 7 | 85.0 | $65,206,137 |
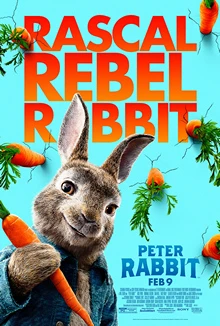 | Peter Rabbit | 2018 | Shared genres: 7 | 84.8 | $61,655,272 |
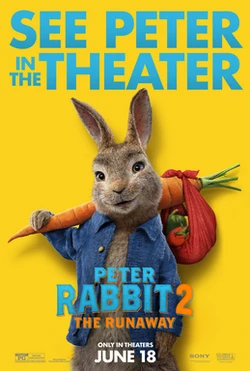 | Peter Rabbit 2: The Runaway | 2021 | Shared genres: 7 | 77.6 | $-9,215,713 |