Net Worth, Earnings & Box Office
Estimated net worth (mid)$229,309,135
Estimated net worth range$191,979,741 - $266,638,529
Estimated career tierA-List
Savings rate range18% - 25%
Total box office (Worldwide)$4,630,537,347
Total box office (Worldwide, inflation-adjusted)$7,718,281,935
Total box office (North America)$2,734,623,351
Total box office (North America, inflation-adjusted)$4,954,277,543
Career earnings (known salaries)$167,478,869
Career earnings (inflation-adjusted)$292,769,602
Films with salary data54
Filmography
| Poster | Movie | Year | Overall Score | Worldwide Box Office | Worldwide (Inflation-Adjusted) | Cast Salary |
|---|---|---|---|---|---|---|
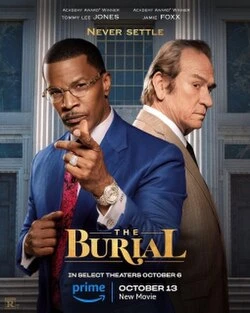 | Burial | 2022 | 38.8 | $8,566 | $9,181 | $1,204,000 (est) |
 | Ad Astra | 2019 | 88.7 | $127,461,870 | $156,373,840 | $4,779,000 (est) |
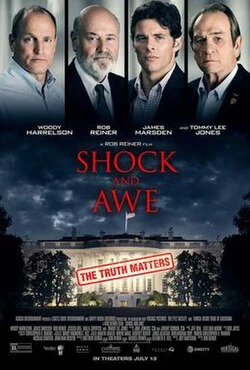 | Shock and Awe | 2018 | 49.3 | $182,415 | $227,892 | $288,000 (est) |
 | Just Getting Started | 2017 | 52.8 | $7,634,022 | $9,770,676 | $651,000 (est) |
 | Just One Drop | 2017 | 21.0 | $60,078 | $76,893 | $651,000 (est) |
 | Criminal | 2016 | 74.3 | $38,803,992 | $50,720,052 | $952,000 (est) |
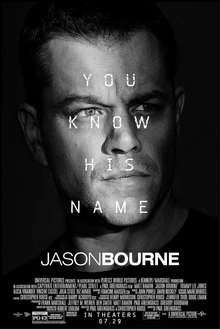 | Jason Bourne | 2016 | 88.5 | $415,484,930 | $543,073,400 | $7,225,000 (est) |
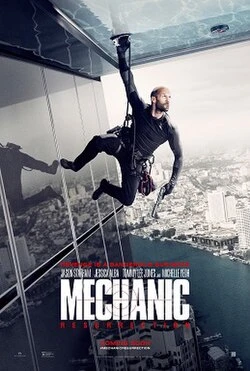 | Mechanic: Resurrection | 2016 | 79.2 | $125,729,630 | $164,339,100 | $1,599,000 (est) |
 | The Homesman | 2014 | 68.4 | $3,819,421 | $5,061,902 | $848,000 (est) |
 | Emperor | 2013 | 62.4 | $14,858,240 | $20,004,420 | $157,000 (est) |
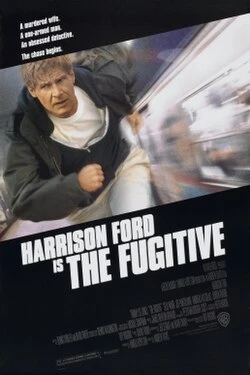 | Little Fugitive | 2013 | 67.1 | $29,505 | $39,724 | $2,119,000 (est) |
 | The Family | 2013 | 77.3 | $78,418,810 | $105,579,320 | $1,000,000 (est) |
 | When Comedy Went to School | 2013 | 56.7 | $369,065 | $496,891 | $1,000,000 (est) |
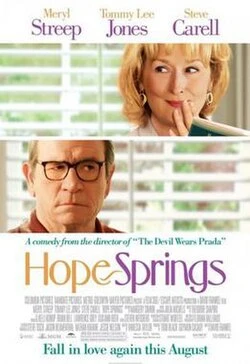 | Hope Springs | 2012 | 78.3 | $114,281,050 | $156,140,960 | $1,777,000 (est) |
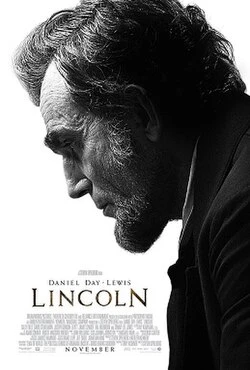 | Lincoln | 2012 | 91.7 | $275,293,440 | $376,130,460 | $350,000 source (Tommy Lee Jones as Republican Congressman. Salary : $ 350,000.) |
 | Men in Black³ | 2012 | 91.9 | $654,213,500 | $893,844,800 | $23,695,000 (est) |
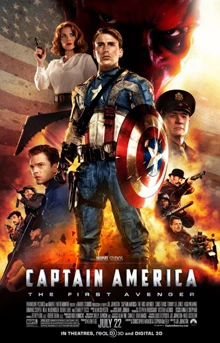 | Captain America: The First Avenger | 2011 | 93.9 | $370,569,760 | $516,886,340 | $6,511,000 (est) |
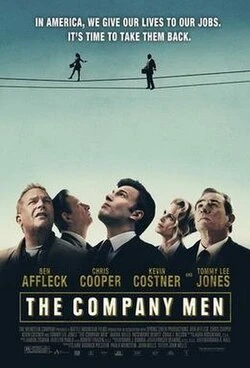 | The Company Men | 2011 | 67.4 | $8,087,000 | $11,280,088 | $342,000 (est) |
 | Harvard Beats Yale 29-29 | 2008 | 37.7 | $268,431 | $391,114 | $6,000 (est) |
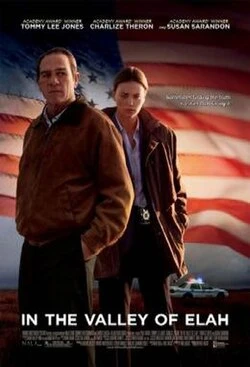 | In the Valley of Elah | 2007 | 73.7 | $29,541,790 | $44,704,580 | $1,871,000 (est) |
 | No Country for Old Men | 2007 | 95.8 | $171,627,170 | $259,717,520 | $750,000 source (According to court documents attached to the complaint, Jones was paid a reduced fee of $750,000 to appear in the 2007 movie, and promised bonuses based on the movie's worldwide box office.) |
 | A Prairie Home Companion | 2006 | 71.8 | $25,978,868 | $40,424,456 | $264,000 (est) |
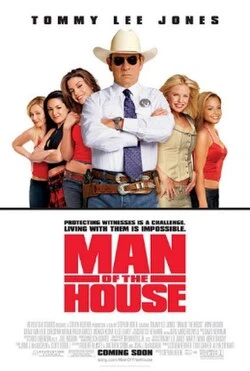 | Man of the House | 2005 | 63.6 | $21,577,624 | $34,658,988 | $2,889,000 (est) |
 | The Three Burials of Melquiades Estrada | 2005 | 69.6 | $12,045,362 | $19,347,824 | $1,078,000 (est) |
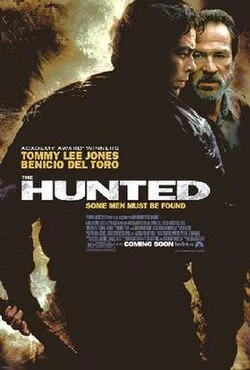 | The Hunted | 2003 | 70.0 | $46,061,848 | $78,530,440 | $10,000,000 source (The Hunted (2003): Even for non-franchise action films, his rate remained high, reportedly earning $10 million for this role.) |
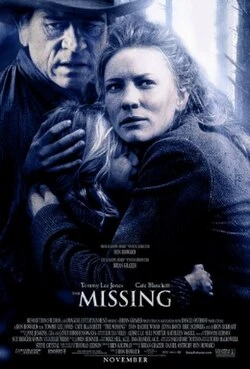 | The Missing | 2003 | 70.9 | $38,364,276 | $65,406,924 | $4,695,000 (est) |
 | Men in Black II | 2002 | 87.5 | $441,818,820 | $770,420,030 | $20,000,000 source (Men in Black II (2002): Jones earned a reported $20 million base salary plus a lucrative back-end deal consisting of 12.5% of the film's profits, a pact that significantly boosted his take-home pay for the sequel.) |
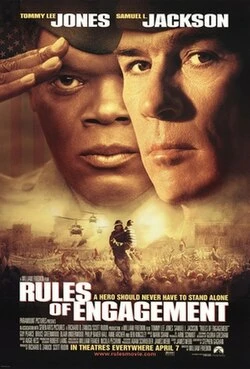 | Rules of Engagement | 2000 | 72.2 | $71,732,304 | $130,676,096 | $4,049,000 (est) |
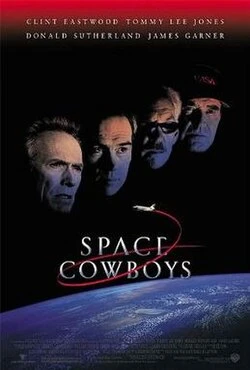 | Space Cowboys | 2000 | 81.6 | $128,884,130 | $234,790,660 | $2,546,000 (est) |
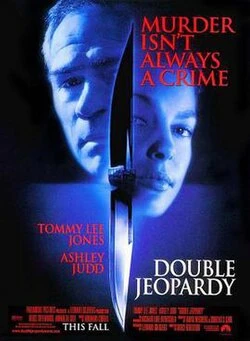 | Double Jeopardy | 1999 | 81.7 | $177,841,550 | $334,867,330 | $4,207,000 (est) |
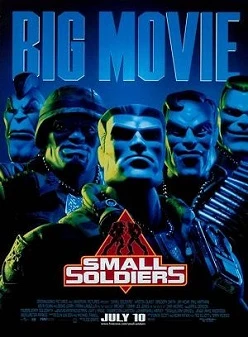 | Small Soldiers | 1998 | 77.1 | $54,682,548 | $105,238,744 | $630,000 (est) |
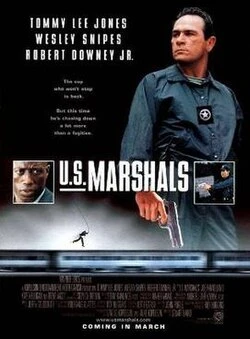 | U.S. Marshals | 1998 | 76.8 | $102,367,410 | $197,010,160 | $17,000,000 source (U.S. Marshals (1998): Reflecting his new status as a leading man after The Fugitive, he commanded a substantial $17 million salary to reprise his role as Samuel Gerard.) |
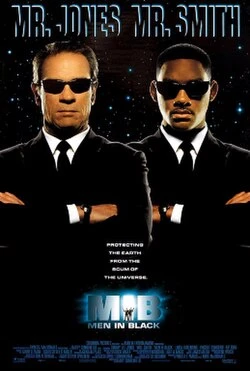 | Men in Black | 1997 | 95.8 | $250,690,540 | $489,978,940 | $7,000,000 source (Men in Black (1997): For the first film in the franchise, he earned a base salary of roughly $7–10 million, marking his definitive entry into the "high-salary" tier of Hollywood actors.) |
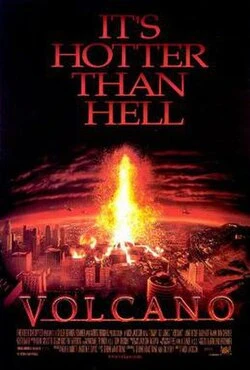 | Volcano | 1997 | 75.7 | $49,323,620 | $96,403,864 | $7,764,000 (est) |
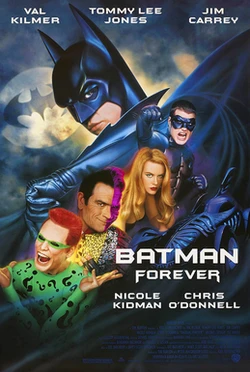 | Batman Forever | 1995 | 85.8 | $184,033,490 | $378,814,340 | $5,557,000 (est) |
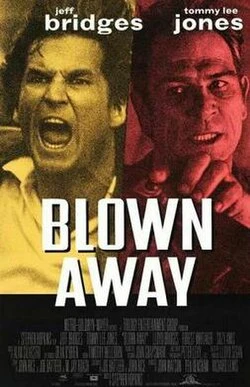 | Blown Away | 1994 | 68.9 | $30,156,002 | $63,832,240 | $1,239,000 (est) |
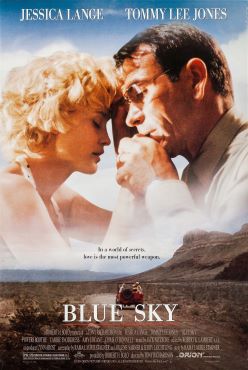 | Blue Sky | 1994 | 39.9 | $3,359,465 | $7,111,094 | $1,219,000 (est) |
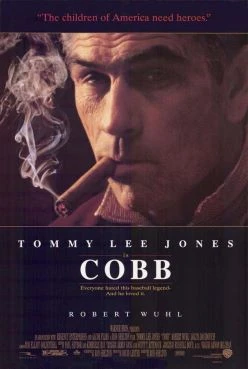 | Cobb | 1994 | 35.3 | $1,007,583 | $2,132,785 | $2,453,000 (est) |
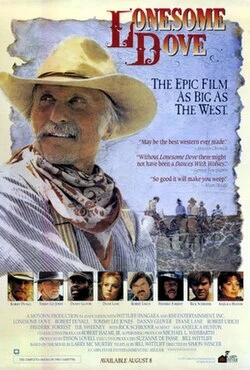 | High Lonesome: The Story of Bluegrass Music | 1994 | 16.9 | $53,319 | $112,862 | $885,000 (est) |
 | The Client | 1994 | 85.7 | $92,115,210 | $194,983,410 | $1,506,000 (est) |
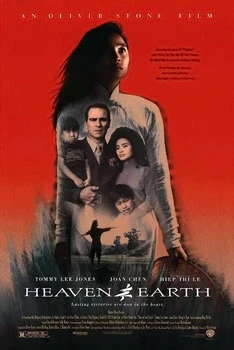 | Heaven & Earth | 1993 | 48.6 | $5,864,949 | $12,732,419 | $2,685,000 (est) |
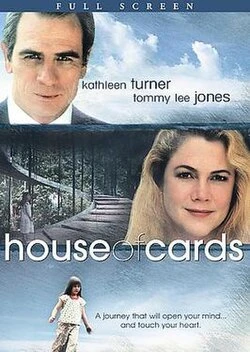 | House of Cards | 1993 | 28.1 | $322,871 | $700,932 | $800,000 (est) |
 | The Fugitive | 1993 | 96.6 | $183,875,790 | $399,182,270 | $2,119,000 (est) |
 | Under Siege | 1992 | 86.1 | $83,563,136 | $186,840,750 | $1,777,000 (est) |
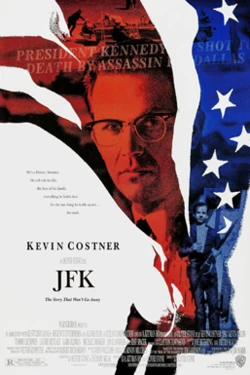 | JFK | 1991 | 91.2 | $70,405,496 | $162,160,100 | $1,251,000 (est) |
 | Fire Birds | 1990 | 46.6 | $14,760,451 | $35,427,340 | $1,102,000 (est) |
 | The Package | 1989 | 58.3 | $10,647,219 | $26,935,746 | $483,000 (est) |
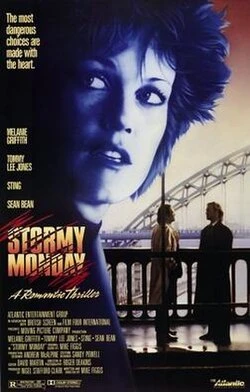 | Stormy Monday | 1988 | 37.8 | $1,791,328 | $4,750,124 | $160,000 (est) |
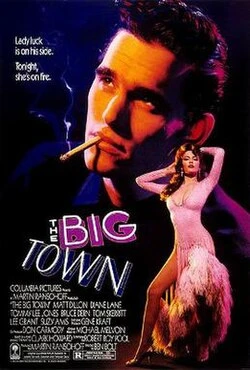 | The Big Town | 1987 | 29.4 | $1,733,017 | $4,785,629 | $377,000 (est) |
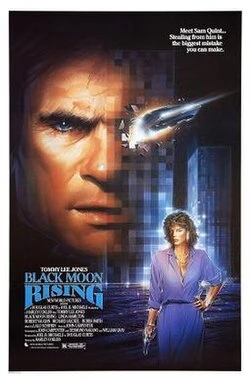 | Black Moon Rising | 1986 | 43.4 | $6,637,565 | $18,998,212 | $173,000 (est) |
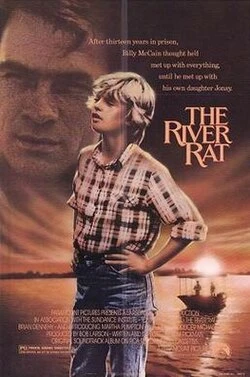 | The River Rat | 1984 | 20.4 | $1,142,944 | $3,450,833 | $19,000 (est) |
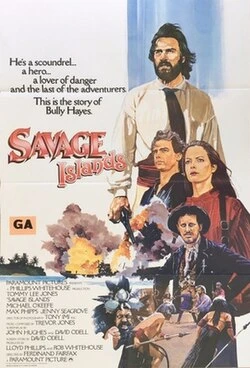 | Savage Islands | 1983 | 13.1 | $1,963,756 | $6,185,042 | $488,000 (est) |
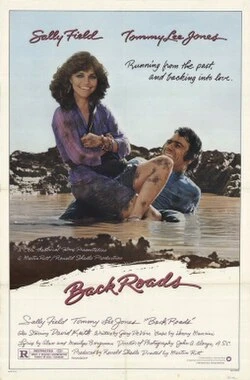 | Back Roads | 1981 | 28.1 | $11,809,387 | $40,754,728 | $488,000 (est) |
 | Coal Miner's Daughter | 1980 | 83.7 | $67,182,784 | $255,767,470 | $2,801,000 (est) |
Basic Facts
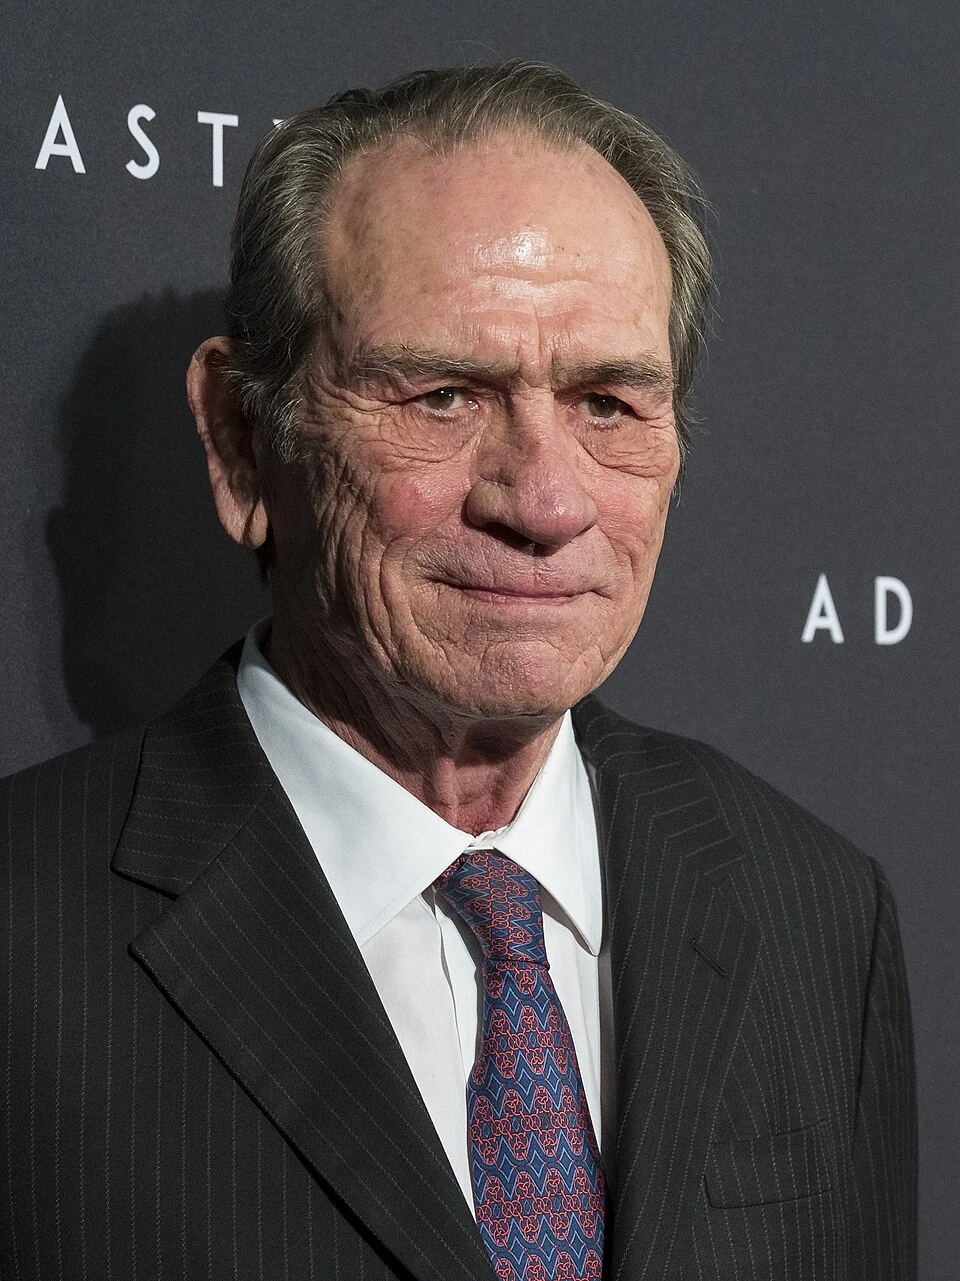
NameTommy Lee Jones
Date of birthN/A
Films in database54
Tooltips
- According to court documents attached to the complaint, Jones was paid a reduced fee of $750,000 to appear in the 2007 movie, and promised bonuses based on the movie's worldwide box office.
- Men in Black (1997): For the first film in the franchise, he earned a base salary of roughly $7–10 million, marking his definitive entry into the "high-salary" tier of Hollywood actors.
- Men in Black II (2002): Jones earned a reported $20 million base salary plus a lucrative back-end deal consisting of 12.5% of the film's profits, a pact that significantly boosted his take-home pay for the sequel.
- The Hunted (2003): Even for non-franchise action films, his rate remained high, reportedly earning $10 million for this role.
- Tommy Lee Jones as Republican Congressman. Salary : $ 350,000.
- U.S. Marshals (1998): Reflecting his new status as a leading man after The Fugitive, he commanded a substantial $17 million salary to reprise his role as Samuel Gerard.
Comments
No approved comments yet.