Movie Box Office and Profits
Cumulative WW Box Office$778,335,935
Cumulative Profit$-245,155,094
Cumulative Domestic Box Office$272,313,384
Average WW Box Office$64,861,328
Average Domestic Box Office$22,692,782
Average Profit / Loss Per Film$-20,429,591
Filmography
| Poster | Movie | Year | Roles | Overall Score | Worldwide | Profit |
|---|---|---|---|---|---|---|
 | Goosebumps 2: Haunted Halloween | 2018 | Production Company | 75.6 | $93,320,384 | $-5,985,627 |
 | Mortal Engines | 2018 | Production Company | 82.0 | $83,672,670 | $-234,141,578 |
 | All I See Is You | 2017 | Production Company | 52.8 | $678,150 | $-26,106,036 |
 | High-Rise | 2016 | Production Company | 66.4 | $4,286,576 | $1,124,190 |
 | Goosebumps | 2015 | Production Company | 86.4 | $158,260,960 | $-26,033,488 |
 | Miss You Already | 2015 | Production Company | 67.2 | $7,573,997 | $9,243,125 |
 | Boogie Woogie | 2010 | Production Company | 31.8 | $48,411 | $-5,118,374 |
 | The Golden Compass | 2007 | Production Company | 86.5 | $372,234,880 | $-26,589,346 |
 | Big Animal | 2004 | Production Company | 28.5 | $3,733 | $810,866 |
 | Clifford's Really Big Movie | 2004 | Production Company | 43.2 | $3,255,426 | $23,793,147 |
 | Tuck Everlasting | 2002 | Production Company | 70.2 | $19,344,616 | $25,382,926 |
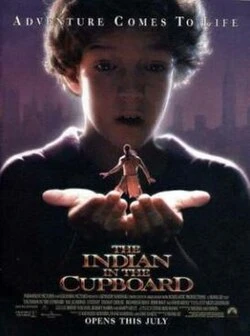 | The Indian in the Cupboard | 1995 | Production Company | 71.1 | $35,656,132 | $18,465,099 |
Basic Facts

NameScholastic Entertainment Inc.
TypeCompany
Role(s)
Production Company
Films in database12
Years in database1995-2018
Role counts
Production Company: 12
Movie Data
Average Movie Score63.5
Movie Score Min28.5
Movie Score Max86.5