Movie Box Office and Profits
Cumulative WW Box Office$1,820,393,084
Cumulative Profit$88,035,573
Cumulative Domestic Box Office$797,098,993
Average WW Box Office$52,011,231
Average Domestic Box Office$22,774,257
Average Profit / Loss Per Film$2,515,302
Filmography
| Poster | Movie | Year | Roles | Overall Score | Worldwide | Profit |
|---|---|---|---|---|---|---|
 | Black Swan | 2025 | Production Company | 71.8 | $815,580 | $-9,544,666 |
 | The Last Voyage of the Demeter | 2023 | Production Company | 77.0 | $21,786,276 | $-40,735,849 |
 | The Hole | 2017 | Production Company | 62.2 | $34,588 | $-12,931,706 |
 | Shanghai | 2015 | Production Company | 24.4 | $46,425 | $-37,753,788 |
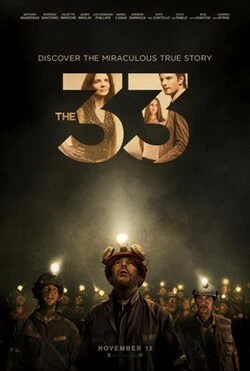 | The 33 | 2015 | Production Company | 72.9 | $27,972,024 | $-9,605,765 |
 | What to Expect When You're Expecting | 2012 | Production Company | 77.0 | $84,384,000 | $-1,289,127 |
 | Black Swan | 2010 | Production Company | 95.1 | $329,398,050 | $152,748,994 |
 | Gulliver's Travels | 2010 | Production Company | 72.9 | $237,382,720 | $-22,058,171 |
 | Shutter Island | 2010 | Production Company | 93.4 | $294,804,200 | $53,209,594 |
 | Backseat | 2008 | Production Company | 44.4 | $12,343 | $-8,846,828 |
 | License to Wed | 2007 | Production Company | 75.0 | $70,181,330 | $19,882,465 |
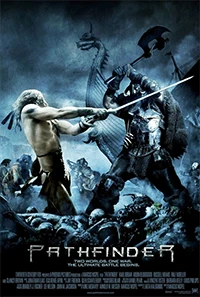 | Pathfinder | 2007 | Production Company | 64.6 | $30,984,584 | $-14,523,259 |
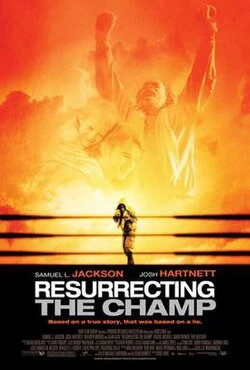 | Resurrecting the Champ | 2007 | Production Company | 60.7 | $3,243,064 | $13,399,512 |
 | Zodiac | 2007 | Production Company | 92.2 | $84,785,910 | $-17,361,604 |
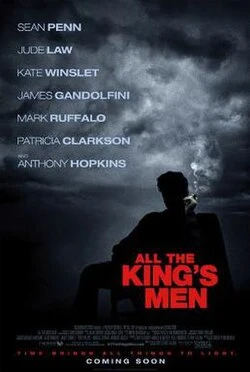 | All the King's Men | 2006 | Production Company | 61.5 | $9,451,623 | $-28,915,055 |
 | Miss Potter | 2006 | Production Company | 79.6 | $35,078,240 | $2,409,099 |
 | Scoop | 2006 | Production Company | 73.9 | $39,220,944 | $43,543,122 |
 | The King | 2006 | Production Company | 44.9 | $740,210 | $-43,523,715 |
 | The Zodiac | 2006 | Production Company | 62.9 | $86,872 | $-61,757,736 |
 | Stealth | 2005 | Production Company | 70.2 | $79,268,320 | $-82,845,810 |
 | Basic | 2003 | Production Company | 73.1 | $42,792,560 | $-2,164,316 |
 | Holes | 2003 | Production Company | 82.7 | $71,406,576 | $51,052,932 |
 | Hometown Legend | 2002 | Production Company | 49.5 | $111,806 | $-4,791,194 |
 | Mad About Mambo | 2000 | Production Company | 27.7 | $65,283 | $3,603,283 |
 | The 6th Day | 2000 | Production Company | 77.1 | $96,085,480 | $-20,639,312 |
 | Urban Legends: Final Cut | 2000 | Production Company | 60.6 | $38,574,360 | $31,840,140 |
 | Whatever It Takes | 2000 | Production Company | 56.1 | $9,902,115 | $-4,355,623 |
 | Dick | 1999 | Production Company | 63.2 | $6,263,240 | $16,073,530 |
 | Lake Placid | 1999 | Production Company | 76.6 | $56,870,416 | $20,867,810 |
 | Apt Pupil | 1998 | Production Company | 61.9 | $8,863,193 | $13,207,763 |
 | Swept from the Sea | 1998 | Production Company | 30.9 | $397,020 | $9,618,858 |
 | The Thin Red Line | 1998 | Production Company | 83.3 | $39,873,660 | $4,699,562 |
 | Urban Legend | 1998 | Production Company | 74.5 | $72,527,590 | $56,642,392 |
 | U Turn | 1997 | Production Company | 62.8 | $6,682,098 | $12,789,753 |
 | The People vs. Larry Flynt | 1996 | Production Company | 77.1 | $20,300,384 | $6,090,288 |
Basic Facts
NamePhoenix Pictures
TypeCompany
Role(s)
Production Company
Films in database35
Years in database1996-2025
Role counts
Production Company: 35
Movie Data
Average Movie Score66.7
Movie Score Min24.4
Movie Score Max95.1