Movie Box Office and Profits
Cumulative WW Box Office$447,211,535
Cumulative Profit$76,962,012
Cumulative Domestic Box Office$113,960,763
Average WW Box Office$10,647,894
Average Domestic Box Office$2,713,352
Average Profit / Loss Per Film$1,832,429
Filmography
| Poster | Movie | Year | Roles | Overall Score | Worldwide | Profit |
|---|---|---|---|---|---|---|
 | Sentimental Value | 2025 | Distributor | 78.3 | $22,437,440 | $8,698,266 |
 | Handling the Undead | 2024 | Studio | 46.7 | $260,627 | $1,183,572 |
 | My Sailor, My Love | 2023 | Production Company | 43.5 | $297,429 | $3,768,595 |
 | Sisu | 2023 | Studio | 82.4 | $14,281,199 | $7,970,291 |
 | Hatching | 2022 | Studio | 62.5 | $508,211 | $3,784,039 |
 | Holy Spider | 2022 | Production Company | 70.2 | $1,706,583 | $7,560,187 |
 | Riders of Justice | 2021 | Studio | 77.0 | $2,001,659 | $4,004,375 |
 | Sabaya | 2021 | Production Company | 29.4 | $14,280 | $1,541,757 |
 | The Queen | 2019 | Studio | 27.3 | $47,818 | $2,601,109 |
 | Becoming Astrid | 2018 | Production Company | 62.1 | $938,766 | $-262,202 |
 | Borg vs. McEnroe | 2018 | Studio | 73.4 | $3,431,867 | $-68,260,013 |
 | The Guilty | 2018 | Studio | 80.1 | $4,598,051 | $8,789,147 |
 | The House That Jack Built | 2018 | Production Company | 65.7 | $170,113 | $-4,340,887 |
 | The Trouble with Terkel | 2017 | Studio | 31.2 | $110,289 | $-5,923,711 |
 | A Man Called Ove | 2016 | Studio | 81.9 | $30,692,888 | $18,595,413 |
 | In Order of Disappearance | 2016 | Studio | 56.6 | $50,251 | $-20,430,874 |
 | Klown Forever | 2016 | Studio | 58.5 | $7,585,569 | $16,098 |
 | Land of Mine | 2016 | Studio | 72.4 | $3,169,553 | $-30,266,840 |
 | Magnus | 2016 | Studio | 41.9 | $101,739 | $-5,353,410 |
 | The Last King | 2016 | Production Company | 79.3 | $3,705,618 | $-3,567,862 |
 | Testament of Youth | 2015 | Production Company | 70.9 | $5,851,758 | $3,384,828 |
 | Nymphomaniac: Vol. I | 2014 | Production Company | 79.7 | $13,264,617 | $12,145,795 |
 | Nymphomaniac: Vol. II | 2014 | Production Company | 75.6 | $4,934,793 | $8,316,859 |
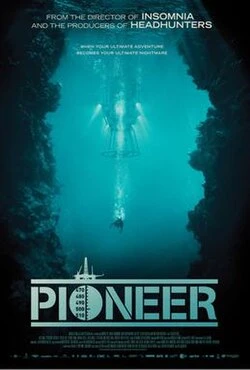 | Pioneer | 2014 | Studio | 51.7 | $2,647,820 | $-727,885 |
 | Kon-Tiki | 2013 | Production Company | 76.8 | $22,842,888 | $-91,456,141 |
 | A Royal Affair | 2012 | Studio | 75.8 | $14,758,997 | $12,322,979 |
 | Easy Money | 2012 | Studio | 66.7 | $8,369,756 | $-20,417,940 |
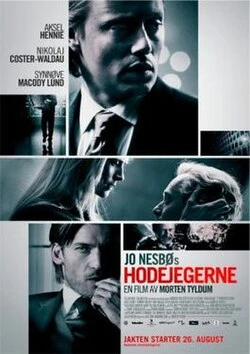 | Headhunters | 2012 | Studio | 81.2 | $18,962,444 | $19,245,718 |
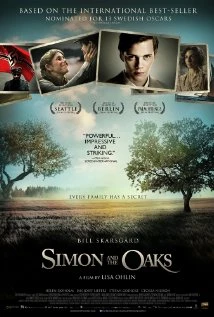 | Simon & the Oaks | 2012 | Studio | 48.7 | $4,505,573 | $5,195,428 |
 | In a Better World | 2011 | Studio | 69.7 | $13,004,504 | $14,519,851 |
 | Melancholia | 2011 | Production Company | 79.7 | $17,217,404 | $14,349,385 |
 | Special Treatment | 2011 | Production Company | 52.3 | $294,483 | $-6,952,321 |
 | Easy A | 2010 | Studio | 86.5 | $75,026,216 | $64,844,999 |
 | The Girl Who Kicked the Hornet's Nest | 2010 | Production Company | 72.0 | $44,276,336 | $32,905,632 |
 | The Girl Who Played with Fire | 2010 | Production Company | 76.8 | $67,153,224 | $36,835,492 |
 | After the Wedding | 2007 | Studio | 72.1 | $11,632,723 | $26,175,381 |
 | Princesses | 2006 | Studio | 52.9 | $8,446,185 | $1,937,421 |
 | Brother to Brother | 2004 | Studio | 41.4 | $80,906 | $12,038,906 |
 | His Brother | 2004 | Studio | 43.7 | $131,195 | $5,501,761 |
 | Boat Trip | 2003 | Studio | 63.8 | $15,020,293 | $16,474,160 |
 | The Trip | 2003 | Studio | 46.6 | $306,567 | $-1,705,958 |
 | Smilla's Sense of Snow | 1997 | Production Company | 48.6 | $2,372,903 | $-18,079,387 |
Basic Facts
Namenordisk film tv fund
TypeCompany
Role(s)
Distributor
Production Company
Studio
Films in database42
Years in database1997-2025
Role counts
Studio: 26
Production Company: 15
Distributor: 1
Movie Data
Average Movie Score63.2
Movie Score Min27.3
Movie Score Max86.5