Synopsis
Three girls in 1980s Stockholm decide to form a punk band -- despite not having any instruments and being told by everyone that punk is dead.
Scores
Overall Score
62.4
Popularity Percentile (Year)
56.5%
Box Office Percentile (Year)
58.0%
Review Aggregate
83.5
Critic Consensus
Critic reception is largely positive, with 97% of 133 logged reviews marked Fresh. Across reviews, critics repeatedly emphasize coming of age, funny, lighthearted. Most critics frame the film as an effective delivery of its core style and intent.
coming of agefunnylightheartedcharacter-drivenfamily-friendlyupliftingstylizedrealisticemotionalscary
Cast
| Cast | Year | Reported Salary | Inflation Adjusted | Notes |
|---|---|---|---|---|
| Mira Barkhammar | 2014 | $10,000 | $13,000 | (est) |
| Mira Grosin | 2014 | $6,000 | $8,000 | (est) |
| Liv LeMoyne | 2014 | $5,000 | $6,000 | (est) |
| Johan Liljemark | 2014 | $4,000 | $5,000 | (est) |
| Mattias Wiberg | 2014 | $3,000 | $4,000 | (est) |
| Jonathan Salomonsson | 2014 | $3,000 | $4,000 | (est) |
| Alvin Strollo | 2014 | $3,000 | $3,000 | (est) |
| Anna Rydgren | 2014 | $2,000 | $3,000 | (est) |
| Peter Erikkson | 2014 | $2,000 | $3,000 | (est) |
| Charlie Falk | 2014 | $2,000 | $3,000 | (est) |
| Lena Carlsson | 2014 | $2,000 | $2,000 | (est) |
| Emrik Ekholm | 2014 | $2,000 | $2,000 | (est) |
| Ann-Sofie Rase | 2014 | $2,000 | $2,000 | (est) |
| Lily Moodysson | 2014 | $2,000 | $2,000 | (est) |
| Nick Kankaanpää | 2014 | $2,000 | $2,000 | (est) |
| Edvin Ottoson | 2014 | $1,000 | $2,000 | (est) |
| Karl Felix Klaesson | 2014 | $1,000 | $2,000 | (est) |
| Victor Norlin Ericsson | 2014 | $1,000 | $2,000 | (est) |
| Petter Andersson | 2014 | $1,000 | $2,000 | (est) |
| Vanja Engström | 2014 | $1,000 | $2,000 | (est) |
| Linnea Thornvall | 2014 | $1,000 | $2,000 | (est) |
Aggregated Reviews
Rotten Tomatoes critic score97.0
RT critic review count133
Rotten Tomatoes audience score77.0
RT audience rating count5,000
IMDb rating7.1
IMDb votes11,647
Box Office ?
| Category | Year | Reported | Inflation Adjusted |
|---|---|---|---|
| Domestic | 2014 | $180,590 | $239,337 |
| International | 2014 | $1,423,683 | $1,886,816 |
| Worldwide | 2014 | $1,604,273 | $2,126,153 |
Earnings / Profitability
| Category | Year | Reported | Inflation Adjusted |
|---|---|---|---|
| Revenues | |||
| Theatrical Net Revenue | 2014 | $659,768 | $874,395 |
| Digital Rentals ? | 2014 | $2,110,000 | $2,796,396 |
| Digital Purchases ? | 2014 | $1,671,000 | $2,214,587 |
| Physical Rentals ? | 2014 | $2,405,000 | $3,187,362 |
| Physical Purchases ? | 2014 | $6,484,000 | $8,593,286 |
| TV & Streaming Revenue | 2014 | $90,295 | $119,669 |
| Total Revenues | 2014 | $13,420,063 | $17,785,694 |
| Expenses | |||
| Budget ? | 2014 | $1,765,000 (est) | $2,339,166 (est) |
| Print & Advertising (P&A) ? | 2014 | $1,283,000 (est) | $1,700,368 (est) |
| Participations | 2014 | $537,000 | $711,689 |
| Residuals ? | 2014 | $778,000 | $1,031,088 |
| Interest & Overhead | 2014 | $353,000 | $467,833 |
| Total Expenses | 2014 | $4,716,000 | $6,250,144 |
| Movie Net Profit or Loss | 2014 | $8,704,063 | $11,535,550 |
Similar Movies
| Poster | Movie | Year | Match | Overall | Est. Profit |
|---|---|---|---|---|---|
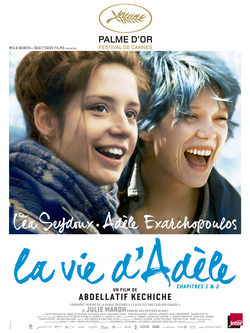 | Blue Is the Warmest Colour | 2013 | Shared genres: 4 | 81.9 | $19,460,489 |
 | Rurouni Kenshin Part I: Origins | 2016 | Shared genres: 4 | 55.7 | $-4,237,778 |
 | The Dark Knight | 2008 | Shared genres: 3 | 98.6 | $250,967,554 |
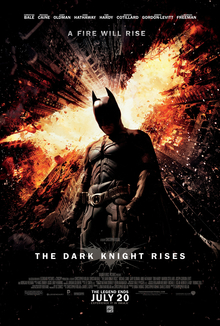 | The Dark Knight Rises | 2012 | Shared genres: 3 | 97.3 | $152,583,234 |
 | Logan | 2017 | Shared genres: 3 | 97.1 | $78,337,860 |