Synopsis
Spinal Tap, one of England's loudest bands, is chronicled by film director Marty DiBergi on what proves to be a fateful tour.
Scores
Overall Score
74.5
Popularity Percentile (Year)
89.3%
Box Office Percentile (Year)
43.7%
Review Aggregate
95.2
Critic Consensus
No professional critic quote data was available to synthesize a consensus summary.
No tags
Cast
| Cast | Year | Reported Salary | Inflation Adjusted | Notes |
|---|---|---|---|---|
| Christopher Guest | 2025 | $96,000 | $96,000 | (est) |
| Michael McKean | 2025 | $59,000 | $59,000 | (est) |
| Harry Shearer | 2025 | $45,000 | $45,000 | (est) |
| Rob Reiner | 2025 | $36,000 | $36,000 | (est) |
| June Chadwick | 2025 | $31,000 | $31,000 | (est) |
| Tony Hendra | 2025 | $27,000 | $27,000 | (est) |
| Bruno Kirby | 2025 | $25,000 | $25,000 | (est) |
Aggregated Reviews
Rotten Tomatoes critic score98.0
RT critic review count174
Rotten Tomatoes audience score92.0
RT audience rating count100,000
IMDb ratingN/A
IMDb votesN/A
Box Office ?
| Category | Year | Reported | Inflation Adjusted |
|---|---|---|---|
| Domestic | 2025 | $1,069,737 | N/A |
| International | 2025 | N/A | N/A |
| Worldwide | 2025 | $1,069,737 | N/A |
Earnings / Profitability
| Category | Year | Reported | Inflation Adjusted |
|---|---|---|---|
| Revenues | |||
| Theatrical Net Revenue | 2025 | $534,868 | N/A |
| Digital Rentals ? | 2025 | $2,279,000 | N/A |
| Digital Purchases ? | 2025 | $3,078,000 | N/A |
| Physical Rentals ? | 2025 | $248,000 | N/A |
| Physical Purchases ? | 2025 | $1,123,000 | N/A |
| TV & Streaming Revenue | 2025 | $427,895 | N/A |
| Total Revenues | 2025 | $7,690,763 | N/A |
| Expenses | |||
| Budget ? | 2025 | $2,000,000 | N/A |
| Print & Advertising (P&A) ? | 2025 | $856,000 (est) | N/A (est) |
| Participations | 2025 | $308,000 | N/A |
| Residuals ? | 2025 | $267,000 | N/A |
| Interest & Overhead | 2025 | $400,000 | N/A |
| Total Expenses | 2025 | $3,831,000 | N/A |
| Movie Net Profit or Loss | 2025 | $3,859,763 | N/A |
Similar Movies
| Poster | Movie | Year | Match | Overall | Est. Profit |
|---|---|---|---|---|---|
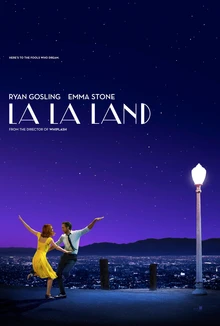 | La La Land | 2016 | Shared genres: 2 | 95.8 | $147,267,772 |
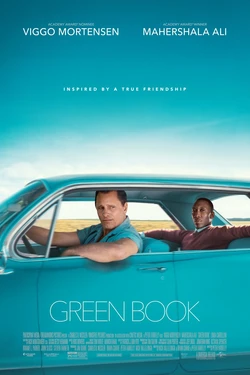 | Green Book | 2018 | Shared genres: 2 | 95.1 | $93,303,120 |
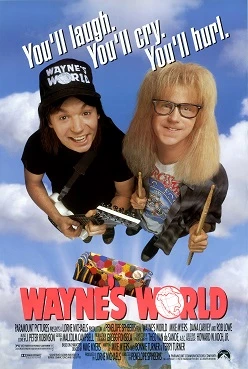 | Wayne's World | 1992 | Shared genres: 2 | 92.7 | $122,027,910 |
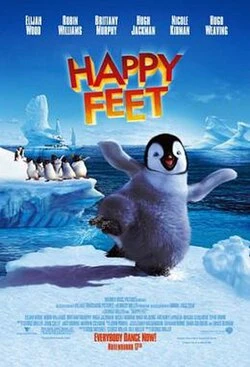 | Happy Feet | 2006 | Shared genres: 2 | 90.8 | $63,605,370 |
 | School of Rock | 2003 | Shared genres: 2 | 90.7 | $54,893,656 |