Synopsis
40 years after the first haunting at Eel Marsh House, a group of children evacuated from WWII London arrives, awakening the house's darkest inhabitant.
Scores
Overall Score
67.9
Popularity Percentile (Year)
72.4%
Box Office Percentile (Year)
83.8%
Review Aggregate
30.0
Critic Consensus
Critic reception is largely negative, with 24% of 78 logged reviews marked Fresh. Across reviews, critics repeatedly emphasize thin plot, scary, suspenseful. Many reviews cite pacing issues, thin plot as the main reasons it falls short.
thin plotscarysuspensefuldarkcharacter-drivenpacing issueshistoricalvisually strikingpsychologicalfamily-friendly
Cast
| Cast | Year | Reported Salary | Inflation Adjusted | Notes |
|---|---|---|---|---|
| Phoebe Fox | 2015 | $978,000 | $1,295,000 | (est) |
| Jeremy Irvine | 2015 | $602,000 | $797,000 | (est) |
| Helen McCrory | 2015 | $453,000 | $600,000 | (est) |
| Adrian Rawlins | 2015 | $371,000 | $491,000 | (est) |
| Leanne Best | 2015 | $317,000 | $420,000 | (est) |
| Ned Dennehy | 2015 | $279,000 | $369,000 | (est) |
Aggregated Reviews
Rotten Tomatoes critic score24.0
RT critic review count78
Rotten Tomatoes audience score24.0
RT audience rating count10,000
IMDb rating4.8
IMDb votes30,221
Box Office ?
| Category | Year | Reported | Inflation Adjusted |
|---|---|---|---|
| Domestic | 2015 | $26,501,324 | $35,077,914 |
| International | 2015 | $22,352,982 | $29,587,049 |
| Worldwide | 2015 | $48,854,304 | $64,664,960 |
Earnings / Profitability
| Category | Year | Reported | Inflation Adjusted |
|---|---|---|---|
| Revenues | |||
| Theatrical Net Revenue | 2015 | $22,191,855 | $29,373,776 |
| Digital Rentals ? | 2015 | $3,654,000 | $4,836,539 |
| Digital Purchases ? | 2015 | $3,832,000 | $5,072,145 |
| Physical Rentals ? | 2015 | $4,145,000 | $5,486,441 |
| Physical Purchases ? | 2015 | $11,108,000 | $14,702,868 |
| TV & Streaming Revenue | 2015 | $6,360,318 | $8,418,699 |
| Total Revenues | 2015 | $51,291,173 | $67,890,469 |
| Expenses | |||
| Budget ? | 2015 | $15,000,000 | $19,854,431 |
| Print & Advertising (P&A) ? | 2015 | $18,750,000 (est) | $24,818,039 (est) |
| Participations | 2015 | $2,052,000 | $2,716,086 |
| Residuals ? | 2015 | $1,656,000 | $2,191,929 |
| Interest & Overhead | 2015 | $3,000,000 | $3,970,886 |
| Total Expenses | 2015 | $40,458,000 | $53,551,371 |
| Movie Net Profit or Loss | 2015 | $10,833,173 | $14,339,098 |
Similar Movies
| Poster | Movie | Year | Match | Overall | Est. Profit |
|---|---|---|---|---|---|
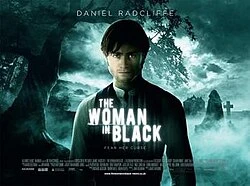 | The Woman in Black | 2012 | Shared franchise (1) | 83.8 | $50,346,010 |
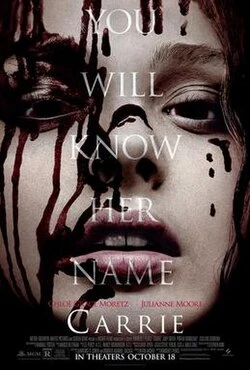 | Carrie | 2013 | Shared genres: 6 | 80.1 | $-1,198,411 |
 | The Omen | 2006 | Shared genres: 6 | 79.0 | $52,390,573 |
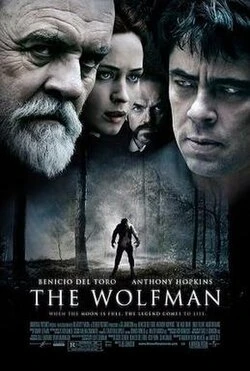 | The Wolfman | 2010 | Shared genres: 6 | 77.6 | $-88,048,204 |
 | The Uninvited | 2009 | Shared genres: 6 | 75.4 | $3,605,210 |