Synopsis
Kermit and his newfound friends trek across America to find success in Hollywood, but a frog legs merchant is after Kermit.
Scores
Overall Score
73.5
Popularity Percentile (Year)
67.1%
Box Office Percentile (Year)
75.0%
Review Aggregate
85.4
Critic Consensus
No professional critic quote data was available to synthesize a consensus summary.
No tags
Cast
| Cast | Year | Reported Salary | Inflation Adjusted | Notes |
|---|---|---|---|---|
| Jim Henson | 1979 | $224,000 | $970,000 | (est) |
| Frank Oz | 1979 | $138,000 | $597,000 | (est) |
| Jerry Nelson | 1979 | $104,000 | $449,000 | (est) |
| Richard Hunt | 1979 | $85,000 | $367,000 | (est) |
| Dave Goelz | 1979 | $73,000 | $314,000 | (est) |
| Charles Durning | 1979 | $64,000 | $277,000 | (est) |
| Austin Pendleton | 1979 | $57,000 | $248,000 | (est) |
| Edgar Bergen | 1979 | $52,000 | $226,000 | (est) |
| Milton Berle | 1979 | $48,000 | $208,000 | (est) |
| Mel Brooks | 1979 | $45,000 | $193,000 | (est) |
| James Coburn | 1979 | $42,000 | $181,000 | (est) |
| Dom DeLuise | 1979 | $39,000 | $170,000 | (est) |
| Elliott Gould | 1979 | $37,000 | $161,000 | (est) |
| Bob Hope | 1979 | $35,000 | $153,000 | (est) |
| Madeline Kahn | 1979 | $34,000 | $146,000 | (est) |
| Carol Kane | 1979 | $32,000 | $139,000 | (est) |
| Cloris Leachman | 1979 | $31,000 | $133,000 | (est) |
| Steve Martin | 1979 | $30,000 | $128,000 | (est) |
| Richard Pryor | 1979 | $29,000 | $123,000 | (est) |
| Telly Savalas | 1979 | $28,000 | $119,000 | (est) |
| Orson Welles | 1979 | $27,000 | $115,000 | (est) |
| Paul Williams | 1979 | $26,000 | $111,000 | (est) |
Aggregated Reviews
Rotten Tomatoes critic score89.0
RT critic review count53
Rotten Tomatoes audience score88.0
RT audience rating count50,000
IMDb rating7.6
IMDb votes41,516
Box Office ?
| Category | Year | Reported | Inflation Adjusted |
|---|---|---|---|
| Domestic | 1979 | $65,847,928 | $284,524,714 |
| International | 1979 | N/A | N/A |
| Worldwide | 1979 | $65,850,688 | $284,536,640 |
Earnings / Profitability
| Category | Year | Reported | Inflation Adjusted |
|---|---|---|---|
| Revenues | |||
| Theatrical Net Revenue | 1979 | $32,923,964 | $142,262,357 |
| Digital Rentals ? | 1979 | N/A | N/A |
| Digital Purchases ? | 1979 | N/A | N/A |
| Physical Rentals ? | 1979 | $2,174,000 | $9,393,716 |
| Physical Purchases ? | 1979 | $2,554,000 | $11,035,672 |
| TV & Streaming Revenue | 1979 | $18,437,420 | $79,666,920 |
| Total Revenues | 1979 | $56,089,384 | $242,358,665 |
| Expenses | |||
| Budget ? | 1979 | $8,000,000 | $34,567,492 |
| Print & Advertising (P&A) ? source | 1979 | $6,000,000 | $25,925,619 |
| Participations | 1979 | $4,487,000 | $19,388,042 |
| Residuals ? | 1979 | $1,226,000 | $5,297,468 |
| Interest & Overhead | 1979 | $1,600,000 | $6,913,498 |
| Total Expenses | 1979 | $21,313,000 | $92,092,119 |
| Movie Net Profit or Loss | 1979 | $34,776,384 | $150,266,546 |
Similar Movies
| Poster | Movie | Year | Match | Overall | Est. Profit |
|---|---|---|---|---|---|
 | The Muppets | 2011 | Shared franchise (1) | 86.6 | $17,357,630 |
 | Muppets Most Wanted | 2014 | Shared franchise (1) | 81.1 | $-17,852,666 |
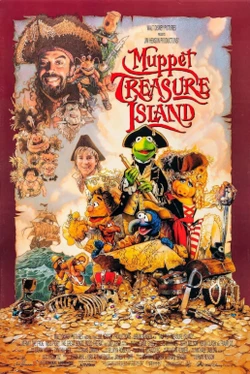 | Muppet Treasure Island | 1996 | Shared franchise (1) | 76.6 | $42,016,034 |
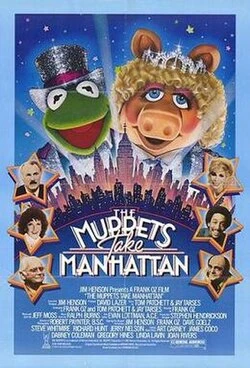 | The Muppets Take Manhattan | 1984 | Shared franchise (1) | 75.0 | $20,556,028 |
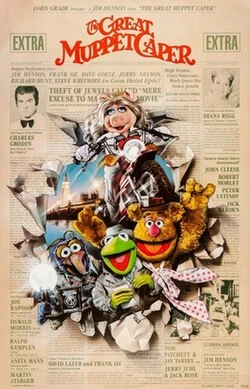 | The Great Muppet Caper | 1981 | Shared franchise (1) | 72.1 | $9,832,689 |