Synopsis
A man who steps into a foster home to drop off some donations tells the kids a story about two teenage friends who uncover a long-lost medallion that transports them back in time.
Scores
Overall Score
40.9
Popularity Percentile (Year)
27.2%
Box Office Percentile (Year)
52.6%
Review Aggregate
51.3
Critic Consensus
Critic reception is mixed, with 50% of 4 logged reviews marked Fresh. Across reviews, critics repeatedly emphasize family-friendly, scary, coming of age. Common reservations focus on execution consistency, even when reviewers praise standout elements.
family-friendlyscarycoming of agestylizedcharacter-drivenemotional
Cast
| Cast | Year | Reported Salary | Inflation Adjusted | Notes |
|---|---|---|---|---|
| Billy Unger | 2013 | $130,000 | $176,000 | (est) |
| Sammi Hanratty | 2013 | $80,000 | $108,000 | (est) |
| James Hong | 2013 | $60,000 | $81,000 | (est) |
| Alex Kendrick | 2013 | $49,000 | $67,000 | (est) |
| Mark Dacascos | 2013 | $42,000 | $57,000 | (est) |
| Jansen Panettiere | 2013 | $37,000 | $50,000 | (est) |
Aggregated Reviews
Rotten Tomatoes critic scoreN/A
RT critic review count4
Rotten Tomatoes audience score53.0
RT audience rating count500
IMDb rating4.9
IMDb votes1,990
Box Office ?
| Category | Year | Reported | Inflation Adjusted |
|---|---|---|---|
| Domestic | 2013 | $549,632 | $739,998 |
| International | 2013 | $156,222 | $210,330 |
| Worldwide | 2013 | $705,854 | $950,328 |
Earnings / Profitability
| Category | Year | Reported | Inflation Adjusted |
|---|---|---|---|
| Revenues | |||
| Theatrical Net Revenue | 2013 | $337,305 | $454,131 |
| Digital Rentals ? | 2013 | $2,512,000 | $3,382,036 |
| Digital Purchases ? | 2013 | $1,502,000 | $2,022,221 |
| Physical Rentals ? | 2013 | $3,246,000 | $4,370,258 |
| Physical Purchases ? | 2013 | $8,412,000 | $11,325,512 |
| TV & Streaming Revenue | 2013 | $230,845 | $310,799 |
| Total Revenues | 2013 | $16,240,150 | $21,864,958 |
| Expenses | |||
| Budget ? | 2013 | $2,500,000 | $3,365,880 |
| Print & Advertising (P&A) ? | 2013 | $565,000 (est) | $760,689 (est) |
| Participations | 2013 | $650,000 | $875,129 |
| Residuals ? | 2013 | $1,007,000 | $1,355,776 |
| Interest & Overhead | 2013 | $500,000 | $673,176 |
| Total Expenses | 2013 | $5,222,000 | $7,030,650 |
| Movie Net Profit or Loss | 2013 | $11,018,150 | $14,834,308 |
Similar Movies
| Poster | Movie | Year | Match | Overall | Est. Profit |
|---|---|---|---|---|---|
 | Miss Peregrine's Home for Peculiar Children | 2016 | Shared genres: 4 | 87.6 | $-45,062,030 |
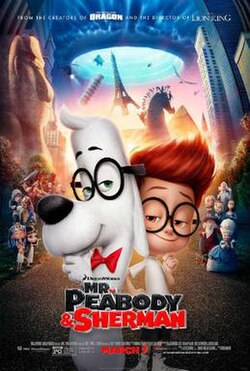 | Mr. Peabody & Sherman | 2014 | Shared genres: 4 | 87.5 | $-79,085,534 |
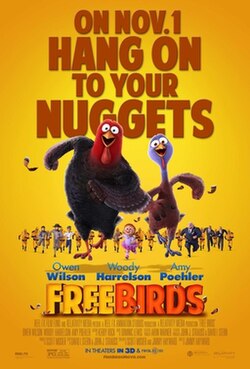 | Free Birds | 2013 | Shared genres: 4 | 72.0 | $-7,768,503 |
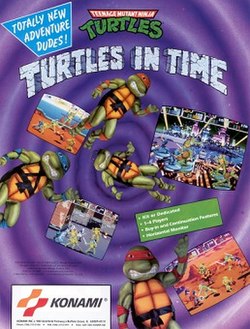 | Teenage Mutant Ninja Turtles III | 1993 | Shared genres: 4 | 70.7 | $62,582,207 |
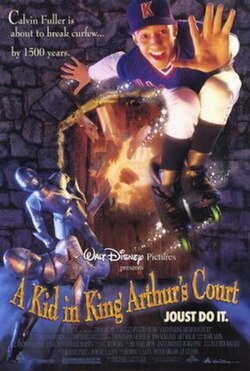 | A Kid in King Arthur's Court | 1995 | Shared genres: 4 | 54.0 | $27,554,971 |