Synopsis
A husband and wife are sucked into a hellish television set and must survive the gauntlet of twisted versions of shows in which they find themselves.
Scores
Overall Score
55.0
Popularity Percentile (Year)
54.0%
Box Office Percentile (Year)
57.3%
Review Aggregate
53.0
Critic Consensus
Critic reception is mixed, with 50% of 8 logged reviews marked Fresh. Across reviews, critics repeatedly emphasize visually striking, family-friendly, scary. Common reservations focus on execution consistency, even when reviewers praise standout elements.
visually strikingfamily-friendlyscarysatiricalfunnystylized
Cast
| Cast | Year | Reported Salary | Inflation Adjusted | Notes |
|---|---|---|---|---|
| John Ritter | 1992 | $1,627,000 | $3,639,000 | (est) |
| Pam Dawber | 1992 | $1,002,000 | $2,240,000 | (est) |
| Jeffrey Jones | 1992 | $754,000 | $1,686,000 | (est) |
| Eugene Levy | 1992 | $617,000 | $1,379,000 | (est) |
Aggregated Reviews
Rotten Tomatoes critic score44.0
RT critic review count16
Rotten Tomatoes audience score56.0
RT audience rating count5,000
IMDb rating6.3
IMDb votes15,009
Box Office ?
| Category | Year | Reported | Inflation Adjusted |
|---|---|---|---|
| Domestic | 1992 | $10,736,401 | $24,005,766 |
| International | 1992 | N/A | N/A |
| Worldwide | 1992 | $10,736,401 | $24,005,766 |
Earnings / Profitability
| Category | Year | Reported | Inflation Adjusted |
|---|---|---|---|
| Revenues | |||
| Theatrical Net Revenue | 1992 | $5,368,200 | $12,002,883 |
| Digital Rentals ? | 1992 | N/A | N/A |
| Digital Purchases ? | 1992 | N/A | N/A |
| Physical Rentals ? | 1992 | $27,962,000 | $62,520,880 |
| Physical Purchases ? | 1992 | $19,953,000 | $44,613,372 |
| TV & Streaming Revenue | 1992 | $2,576,736 | $5,761,384 |
| Total Revenues | 1992 | $55,859,937 | $124,898,519 |
| Expenses | |||
| Budget ? | 1992 | $20,000,000 | $44,718,460 |
| Print & Advertising (P&A) ? | 1992 | $4,255,000 (est) | $9,513,852 (est) |
| Participations | 1992 | $2,234,000 | $4,995,052 |
| Residuals ? | 1992 | $3,660,000 | $8,183,478 |
| Interest & Overhead | 1992 | $4,000,000 | $8,943,692 |
| Total Expenses | 1992 | $34,149,000 | $76,354,535 |
| Movie Net Profit or Loss | 1992 | $21,710,937 | $48,543,983 |
Similar Movies
| Poster | Movie | Year | Match | Overall | Est. Profit |
|---|---|---|---|---|---|
 | Aladdin | 1992 | Shared genres: 4 | 97.7 | $232,328,117 |
 | Thor: Ragnarok | 2017 | Shared genres: 4 | 97.1 | $78,916,080 |
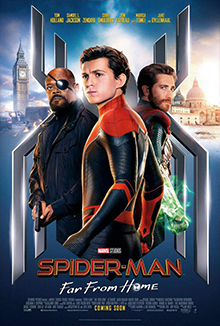 | Spider-Man: Far from Home | 2019 | Shared genres: 4 | 97.0 | $77,501,637 |
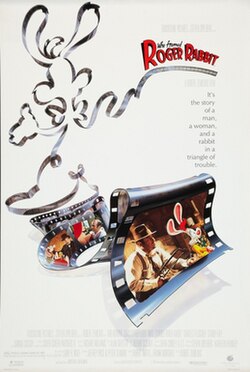 | Who Framed Roger Rabbit | 1988 | Shared genres: 4 | 96.2 | $70,976,382 |
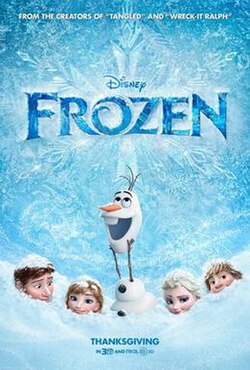 | Frozen | 2013 | Shared genres: 4 | 96.1 | $294,764,017 |