Synopsis
In the backdrop of a destination wedding in London, two families try to save their respective empires, unbeknownst to each other.
Scores
Overall Score
51.0
Popularity Percentile (Year)
45.8%
Box Office Percentile (Year)
71.8%
Review Aggregate
26.5
Critic Consensus
Critic reception is largely negative, with 23% of 13 logged reviews marked Fresh. Across reviews, critics repeatedly emphasize funny, thin plot, romantic. Many reviews cite thin plot as the main reasons it falls short.
funnythin plotromanticcharacter-drivenemotionalvisually striking
Cast
| Cast | Year | Reported Salary | Inflation Adjusted | Notes |
|---|---|---|---|---|
| Shahid Kapoor | 2015 | $129,985,000 | $172,052,000 | (est) |
| Alia Bhatt | 2015 | $80,015,000 | $105,910,000 | (est) |
Aggregated Reviews
Rotten Tomatoes critic score23.0
RT critic review count13
Rotten Tomatoes audience score23.0
RT audience rating count250
IMDb rating3.7
IMDb votes6,788
Box Office ?
| Category | Year | Reported | Inflation Adjusted |
|---|---|---|---|
| Domestic | 2015 | $521,794 | $690,662 |
| International | 2015 | $13,599,014 | $18,000,045 |
| Worldwide | 2015 | $14,120,808 | $18,690,707 |
Earnings / Profitability
| Category | Year | Reported | Inflation Adjusted |
|---|---|---|---|
| Revenues | |||
| Theatrical Net Revenue | 2015 | $5,700,503 | $7,545,349 |
| Digital Rentals ? | 2015 | $2,202,000 | $2,914,630 |
| Digital Purchases ? | 2015 | $2,309,000 | $3,056,259 |
| Physical Rentals ? | 2015 | $2,498,000 | $3,306,424 |
| Physical Purchases ? | 2015 | $6,694,000 | $8,860,370 |
| TV & Streaming Revenue | 2015 | $219,153 | $290,078 |
| Total Revenues | 2015 | $19,622,656 | $25,973,111 |
| Expenses | |||
| Budget ? | 2015 | $600,000,000 | $794,177,215 |
| Print & Advertising (P&A) ? | 2015 | $2,871,000 (est) | $3,800,138 (est) |
| Participations | 2015 | $392,000 | $518,862 |
| Residuals ? | 2015 | $821,000 | $1,086,699 |
| Interest & Overhead | 2015 | $72,000,000 | $95,301,266 |
| Total Expenses | 2015 | $676,084,000 | $894,884,181 |
| Movie Net Profit or Loss | 2015 | $-656,461,344 | $-868,911,070 |
Similar Movies
| Poster | Movie | Year | Match | Overall | Est. Profit |
|---|---|---|---|---|---|
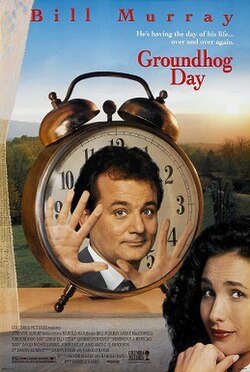 | Groundhog Day | 1993 | Shared genres: 4 | 95.4 | $78,676,439 |
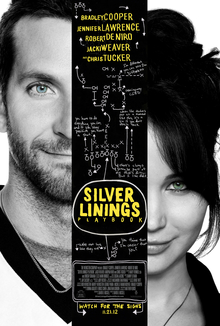 | Silver Linings Playbook | 2012 | Shared genres: 4 | 94.9 | $98,374,305 |
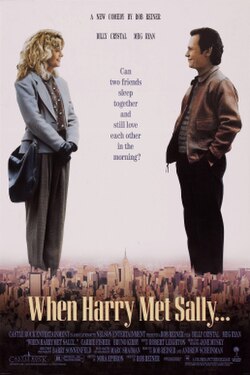 | When Harry Met Sally... | 1989 | Shared genres: 4 | 94.1 | $84,958,366 |
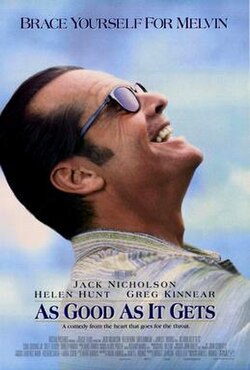 | As Good as It Gets | 1997 | Shared genres: 4 | 94.0 | $89,663,849 |
 | Notting Hill | 1999 | Shared genres: 4 | 93.8 | $129,254,949 |