Screen Profits
Most Profitable Movies
Most Profitable Movies
Movies Decade
Genres
Franchises
Actor Net Worth Rankings
Back to movie
Run & Jump (2014) Similar Movies
20 similar titles
Similar Movies
Knives Out
Year
2019
Overall
96.6
Est. Profit
$77,594,195
Brave
Year
2012
Overall
93.2
Est. Profit
$-7,895,104
Murder on the Orient Express
Year
2017
Overall
88.9
Est. Profit
$50,234,212
Glass Onion
Year
2022
Overall
88.3
Est. Profit
$-24,048,800
Hail, Caesar!
Year
2016
Overall
83.6
Est. Profit
$2,723,411
Wicked Little Letters
Year
2024
Overall
82.8
Est. Profit
$-2,177,019
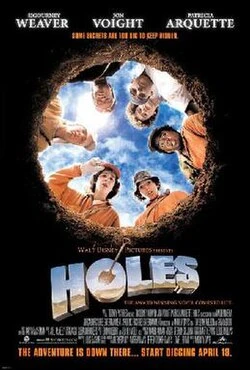
Holes
Year
2003
Overall
82.7
Est. Profit
$51,052,932
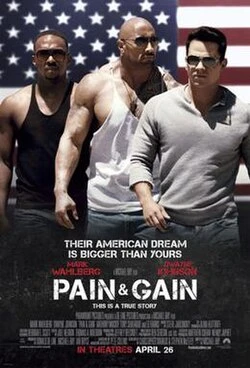
Pain & Gain
Year
2013
Overall
82.3
Est. Profit
$13,781,571
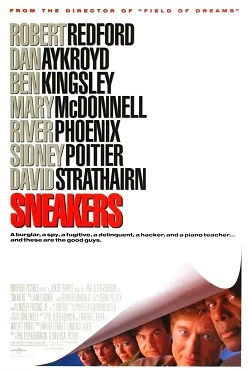
Sneakers
Year
1992
Overall
81.8
Est. Profit
$70,354,519
Paper Towns
Year
2015
Overall
81.7
Est. Profit
$33,067,026
Tully
Year
2018
Overall
81.6
Est. Profit
$-568,698
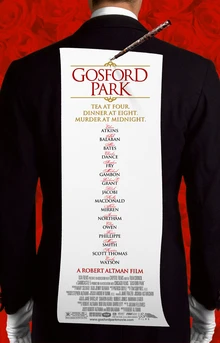
Gosford Park
Year
2001
Overall
80.5
Est. Profit
$57,331,633
Fright Night
Year
2011
Overall
79.6
Est. Profit
$-4,361,070
Haunted Mansion
Year
2023
Overall
79.5
Est. Profit
$-179,303,431
Broken Flowers
Year
2005
Overall
79.2
Est. Profit
$37,895,270
The Bob's Burgers Movie
Year
2022
Overall
79.1
Est. Profit
$-16,279,998
Amsterdam
Year
2022
Overall
78.4
Est. Profit
$-69,113,367
Inherent Vice
Year
2014
Overall
78.2
Est. Profit
$-7,718,878
Another 48 Hrs.
Year
1990
Overall
76.6
Est. Profit
$53,768,801
The Best Christmas Pageant Ever
Year
2024
Overall
75.8
Est. Profit
$16,278,950
 Knives Out