Synopsis
While most sports films celebrate the quest for a championship, "Quantum Hoops" follows a team that is searching for a single win. The documentary chronicles the final week of the 2006 Caltech basketball season. The team is currently in the midst of a 21 year losing streak - over 240 consecutive conference losses. Caltech is annually considered one of the top 5 academic institutions in the world yet its athletic department always takes a back seat to the achievements of its world renowned faculty, Nobel prize winners, and advancements in the world of science and technology. The film "Real Genius" was a not-so-subtle take on Caltech life. To the casual fan, the team might sound like a bad joke. There are more valedictorians on the team than players with high school basketball experience. In fact, the 5 seniors did not play high school basketball, yet all five are major contributors to the team. They are roundly mocked by opposing fans as "nerds playing basketball" (the few fans that decide its even worth it to show up). However, this season would mark an amazing turnaround from just two years ago when the team would lose by an average margin of over 60 points per game. Against remarkable odds and adversity, the players and coaches dedication, discipline, heart, and yes, SKILL would make for one of the most exciting seasons in school history. The final home game of the year would give the 5 seniors one last shot at that elusive win and an entry into the history books of college athletics.
Scores
Popularity Percentile (Year)
3.3%
Box Office Percentile (Year)
6.0%
Critic Consensus
80.0% Fresh • 20 critic reviews
Critic reception is largely positive, with 80% of 20 logged reviews marked Fresh. Across reviews, critics repeatedly emphasize lighthearted, funny, uplifting. Most critics frame the film as an effective delivery of its core style and intent.
lightheartedfunnyupliftingcharacter-drivenemotionalvisually striking
Cast
| Cast | Year | Reported Salary | Inflation Adjusted | Notes |
|---|
| N/A |
Aggregated Reviews
Rotten Tomatoes critic score81.0
RT critic review count21
Rotten Tomatoes audience score90.0
RT audience rating count100
IMDb rating7.9
IMDb votes97
Box Office ?
| Category | Year | Reported | Inflation Adjusted |
|---|
| Domestic | 2007 | $7,075 | $10,706 |
| International | 2007 | N/A | N/A |
| Worldwide | 2007 | $7,075 | $10,706 |
Earnings / Profitability
Estimated net revenues and net expenses for films based on reported and estimated numbers. This income statement should be considered most viable for the first 24 months after the inital movie's release (ie after most lucrative pay windows).
| Category | Year | Reported | Inflation Adjusted |
|---|
| Revenues |
| Theatrical Net Revenue | 2007 | $3,538 | $5,353 |
| Digital Rentals ? | 2007 | $41,000 | $62,044 |
| Digital Purchases ? | 2007 | $15,000 | $22,699 |
| Physical Rentals ? | 2007 | $698,000 | $1,056,259 |
| Physical Purchases ? | 2007 | $1,567,000 | $2,371,287 |
| TV & Streaming Revenue | 2007 | $75,000 | $113,495 |
| Total Revenues | 2007 | $2,399,538 | $3,631,138 |
| Expenses |
| Budget ? | 2007 | $250,000 (est) | $378,316 (est) |
| Print & Advertising (P&A) ? | 2007 | $80,000 (est) | $121,061 (est) |
| Participations | 2007 | $96,000 | $145,274 |
| Residuals ? | 2007 | $164,000 | $248,176 |
| Interest & Overhead | 2007 | $50,000 | $75,663 |
| Total Expenses | 2007 | $640,000 | $968,490 |
| Movie Net Profit or Loss | 2007 | $1,759,538 | $2,662,648 |
Similar Movies
| Poster | Movie | Year | Match | Overall | Est. Profit |
|---|
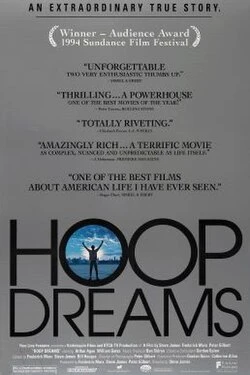 | Hoop Dreams | 1994 | Shared genres: 5 | 63.1 | $39,486,652 |
 | The Heart of the Game | 2006 | Shared genres: 5 | 49.7 | $22,493,613 |
 | Through the Fire | 2006 | Shared genres: 5 | 49.3 | $7,716,176 |
 | More Than a Game | 2009 | Shared genres: 5 | 48.7 | $21,593,292 |
 | The Other Dream Team | 2012 | Shared genres: 5 | 45.8 | $10,394,228 |
Tooltips
- Budget Estimated using Machine Learning
- Digital Rentals: PVOD, VOD, & On-Demand
- Marketing & distribution costs to release Movie in Theaters. Includes: Online & Offline Ads, Posters, Trailer Production, and physical or digital copies (formerly "prints") sent to cinemas.
- Net Digital Purchase Revenue
- Net Revenues for Physical Rentals: VHS, DVD, BluRay (when appropriate)
- Physical Purchases: VHS $0, DVD $1,517,000, BluRay $50,000
- Reported or Estimated Net Budget (after tax, product placements, & grants)
- Theatrical box office grosses split into Domestic, International, and Worldwide totals.
- Union-modeled residuals using SAG-AFTRA and WGA schedules as a simplified estimate proxy.
- reestimate_prior_estimate;covid_mult=1.00;peer_count=0;reg_box_pred=26416;reg_main_pred=131094
Budget Tooltip
Reported or Estimated Net Budget (after tax, product placements, & grants)
Comments
No approved comments yet.