Synopsis
Larry Daley and his heroic friends embark on the greatest adventure of their lives, as they travel to London to save the magic that, after dark, allows the museum's exhibits to come to life.
Scores
Overall Score
86.4
Popularity Percentile (Year)
92.3%
Box Office Percentile (Year)
97.0%
Review Aggregate
54.6
Critic Consensus
Critic reception is mixed, with 49% of 111 logged reviews marked Fresh. Across reviews, critics repeatedly emphasize thin plot, family-friendly, funny. Common reservations focus on thin plot, even when reviewers praise standout elements.
thin plotfamily-friendlyfunnylightheartedvisually strikingchristmasemotionalupliftingcharacter-drivensurreal
Cast
| Cast | Year | Reported Salary | Inflation Adjusted | Notes |
|---|---|---|---|---|
| Ben Stiller | 2014 | $13,695,000 | $18,150,000 | (est) |
| Robin Williams | 2014 | $8,430,000 | $11,172,000 | (est) |
| Owen Wilson | 2014 | $6,347,000 | $8,412,000 | (est) |
| Dan Stevens | 2014 | $5,189,000 | $6,877,000 | (est) |
| Ben Kingsley | 2014 | $4,439,000 | $5,883,000 | (est) |
Aggregated Reviews
Rotten Tomatoes critic score48.0
RT critic review count112
Rotten Tomatoes audience score57.0
RT audience rating count100,000
IMDb rating6.2
IMDb votes144,764
Box Office ?
| Category | Year | Reported | Inflation Adjusted |
|---|---|---|---|
| Domestic | 2014 | $113,746,624 | $150,749,112 |
| International | 2014 | $249,458,020 | $330,608,273 |
| Worldwide | 2014 | $363,204,640 | $481,357,380 |
Earnings / Profitability
| Category | Year | Reported | Inflation Adjusted |
|---|---|---|---|
| Revenues | |||
| Theatrical Net Revenue | 2014 | $156,656,520 | $207,617,865 |
| Digital Rentals ? | 2014 | $4,945,000 | $6,553,639 |
| Digital Purchases ? | 2014 | $3,917,000 | $5,191,225 |
| Physical Rentals ? | 2014 | $5,637,000 | $7,470,751 |
| Physical Purchases ? | 2014 | $15,196,000 | $20,139,354 |
| TV & Streaming Revenue | 2014 | $31,849,055 | $42,209,751 |
| Total Revenues | 2014 | $218,200,575 | $289,182,586 |
| Expenses | |||
| Budget ? | 2014 | $127,000,000 | $168,313,894 |
| Print & Advertising (P&A) ? | 2014 | $83,640,000 (est) | $110,848,615 (est) |
| Participations | 2014 | $4,364,000 | $5,783,636 |
| Residuals ? | 2014 | $3,355,000 | $4,446,402 |
| Interest & Overhead | 2014 | $15,240,000 | $20,197,667 |
| Total Expenses | 2014 | $233,599,000 | $309,590,215 |
| Movie Net Profit or Loss | 2014 | $-15,398,425 | $-20,407,629 |
Similar Movies
| Poster | Movie | Year | Match | Overall | Est. Profit |
|---|---|---|---|---|---|
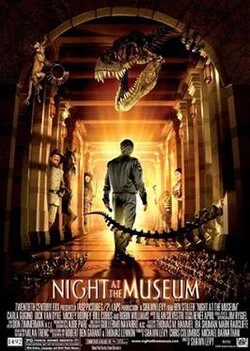 | Night at the Museum | 2006 | Shared franchise (1) | 89.7 | $134,277,371 |
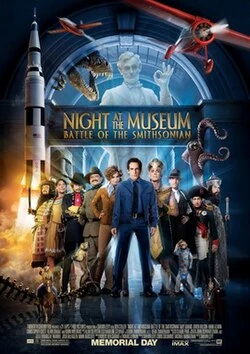 | Night at the Museum: Battle of the Smithsonian | 2009 | Shared franchise (1) | 85.8 | $8,309,089 |
 | Toy Story 3 | 2010 | Shared genres: 4 | 98.0 | $216,158,051 |
 | Toy Story | 1995 | Shared genres: 4 | 97.9 | $171,576,210 |
 | Aladdin | 1992 | Shared genres: 4 | 97.7 | $232,328,119 |