Synopsis
A group of animals who have spent all their life in a New York zoo end up in the jungles of Madagascar, and must adjust to living in the wild.
Scores
Overall Score
89.9
Popularity Percentile (Year)
94.9%
Box Office Percentile (Year)
99.0%
Review Aggregate
62.7
Critic Consensus
Critic reception is mixed, with 55% of 190 logged reviews marked Fresh. Across reviews, critics repeatedly emphasize funny, family-friendly, thin plot. Common reservations focus on thin plot, even when reviewers praise standout elements.
funnyfamily-friendlythin plotvisually strikinglightheartedstylizedscarycoming of agecharacter-driven
Cast
| Cast | Year | Reported Salary | Inflation Adjusted | Notes |
|---|---|---|---|---|
| Ben Stiller | 2005 | $7,323,000 | $11,763,000 | (est) |
| Chris Rock | 2005 | $4,508,000 | $7,241,000 | (est) |
| David Schwimmer | 2005 | $3,394,000 | $5,452,000 | (est) |
| Jada Pinkett Smith | 2005 | $2,775,000 | $4,457,000 | (est) |
Aggregated Reviews
Rotten Tomatoes critic score55.0
RT critic review count192
Rotten Tomatoes audience score67.0
RT audience rating count50,000
IMDb rating6.9
IMDb votes465,365
Box Office ?
| Category | Year | Reported | Inflation Adjusted |
|---|---|---|---|
| Domestic | 2005 | $193,595,520 | $310,962,147 |
| International | 2005 | $348,468,320 | $559,726,057 |
| Worldwide | 2005 | $542,063,900 | $870,688,300 |
Earnings / Profitability
| Category | Year | Reported | Inflation Adjusted |
|---|---|---|---|
| Revenues | |||
| Theatrical Net Revenue | 2005 | $236,185,088 | $379,371,496 |
| Digital Rentals ? | 2005 | $374,000 | $600,736 |
| Digital Purchases ? | 2005 | $58,000 | $93,162 |
| Physical Rentals ? | 2005 | $20,868,000 | $33,519,154 |
| Physical Purchases ? | 2005 | $50,097,000 | $80,468,136 |
| TV & Streaming Revenue | 2005 | $54,206,746 | $87,069,401 |
| Total Revenues | 2005 | $361,788,834 | $581,122,086 |
| Expenses | |||
| Budget ? | 2005 | $75,000,000 | $120,468,496 |
| Print & Advertising (P&A) ? | 2005 | $56,307,000 (est) | $90,442,928 (est) |
| Participations | 2005 | $54,268,000 | $87,167,791 |
| Residuals ? | 2005 | $7,863,000 | $12,629,917 |
| Interest & Overhead | 2005 | $11,250,000 | $18,070,274 |
| Total Expenses | 2005 | $204,688,000 | $328,779,405 |
| Movie Net Profit or Loss | 2005 | $157,100,834 | $252,342,681 |
Similar Movies
| Poster | Movie | Year | Match | Overall | Est. Profit |
|---|---|---|---|---|---|
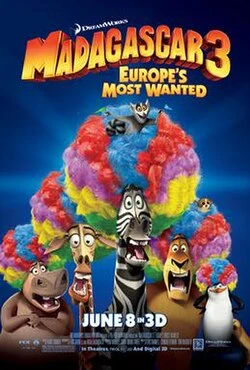 | Madagascar 3: Europe's Most Wanted | 2012 | Shared franchise (1) | 91.9 | $63,564,282 |
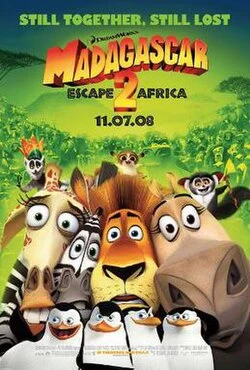 | Madagascar: Escape 2 Africa | 2008 | Shared franchise (1) | 90.9 | $40,691,293 |
 | Penguins of Madagascar | 2014 | Shared franchise (1) | 87.5 | $-38,999,938 |
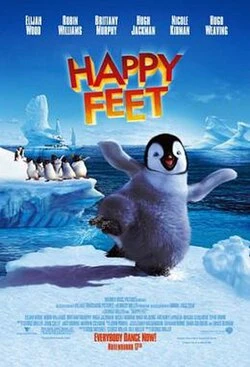 | Happy Feet | 2006 | Shared genres: 7 | 90.8 | $63,605,370 |
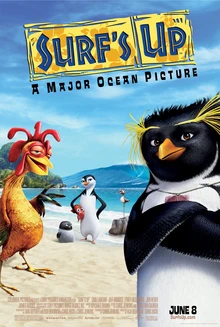 | Surf's Up | 2007 | Shared genres: 7 | 86.9 | $-7,532,022 |