Synopsis
A working-class family man, Christopher Robin, encounters his childhood friend Winnie-the-Pooh, who helps him to rediscover the joys of life.
Scores
Overall Score
88.6
Popularity Percentile (Year)
89.1%
Box Office Percentile (Year)
95.0%
Review Aggregate
76.2
Critic Consensus
Critic reception is mixed, with 73% of 274 logged reviews marked Fresh. Across reviews, critics repeatedly emphasize thin plot, lighthearted, family-friendly. Common reservations focus on thin plot, even when reviewers praise standout elements.
thin plotlightheartedfamily-friendlyemotionalfunnyupliftingcharacter-drivenrealisticdarkvisually striking
Cast
| Cast | Year | Reported Salary | Inflation Adjusted | Notes |
|---|---|---|---|---|
| Ewan McGregor | 2018 | $3,000,000 source | $3,747,909 | reported |
| Hayley Atwell | 2018 | $3,983,000 | $4,976,000 | (est) |
| Jim Cummings | 2018 | $2,999,000 | $3,746,000 | (est) |
| Nick Mohamed | 2018 | $2,452,000 | $3,063,000 | (est) |
| Brad Garrett | 2018 | $2,097,000 | $2,620,000 | (est) |
Aggregated Reviews
Rotten Tomatoes critic score73.0
RT critic review count274
Rotten Tomatoes audience score83.0
RT audience rating count5,000
IMDb rating7.2
IMDb votes89,033
Box Office ?
| Category | Year | Reported | Inflation Adjusted |
|---|---|---|---|
| Domestic | 2018 | $99,215,042 | $123,949,656 |
| International | 2018 | $98,529,335 | $123,093,000 |
| Worldwide | 2018 | $197,744,377 | $247,042,657 |
Earnings / Profitability
| Category | Year | Reported | Inflation Adjusted |
|---|---|---|---|
| Revenues | |||
| Theatrical Net Revenue | 2018 | $89,019,255 | $111,212,028 |
| Digital Rentals ? | 2018 | $4,237,000 | $5,293,297 |
| Digital Purchases ? | 2018 | $5,109,000 | $6,382,689 |
| Physical Rentals ? | 2018 | $2,610,000 | $3,260,681 |
| Physical Purchases ? | 2018 | $7,404,000 | $9,249,840 |
| TV & Streaming Revenue | 2018 | $24,803,760 | $30,987,414 |
| Total Revenues | 2018 | $133,183,016 | $166,385,950 |
| Expenses | |||
| Budget ? | 2018 | $75,000,000 | $93,697,730 |
| Print & Advertising (P&A) ? | 2018 | $51,755,000 (est) | $64,657,680 (est) |
| Participations | 2018 | $2,664,000 | $3,328,143 |
| Residuals ? | 2018 | $2,200,000 | $2,748,467 |
| Interest & Overhead | 2018 | $11,250,000 | $14,054,659 |
| Total Expenses | 2018 | $142,869,000 | $178,486,680 |
| Movie Net Profit or Loss | 2018 | $-9,685,984 | $-12,100,730 |
Similar Movies
| Poster | Movie | Year | Match | Overall | Est. Profit |
|---|---|---|---|---|---|
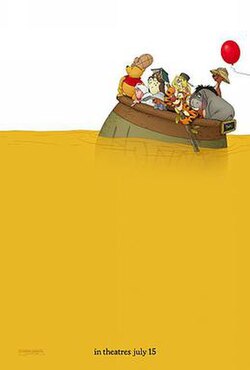 | Winnie the Pooh | 2011 | Shared franchise (1) | 75.5 | $-4,075,861 |
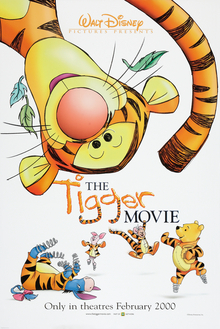 | The Tigger Movie | 2000 | Shared franchise (1) | 75.3 | $31,699,007 |
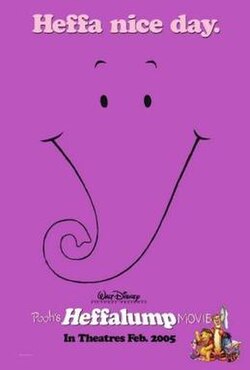 | Pooh's Heffalump Movie | 2005 | Shared franchise (1) | 67.4 | $21,327,840 |
 | Into the Woods | 2014 | Shared genres: 7 | 85.8 | $26,896,850 |
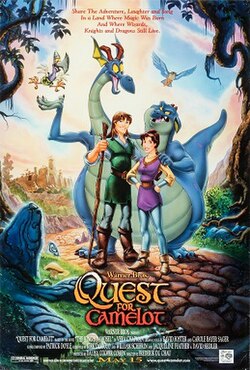 | Quest for Camelot | 1998 | Shared genres: 7 | 62.8 | $-2,670,902 |