Synopsis
While emigrating to the United States, a young Russian mouse gets separated from his family and must locate them while trying to survive in a new country.
Scores
Overall Score
89.6
Popularity Percentile (Year)
95.8%
Box Office Percentile (Year)
91.4%
Review Aggregate
72.5
Critic Consensus
Critic reception is largely positive, with 75% of 80 logged reviews marked Fresh. Across reviews, critics repeatedly emphasize family-friendly, lighthearted, visually striking. Most critics frame the film as an effective delivery of its core style and intent.
family-friendlylightheartedvisually strikingstylizedscaryemotionalsuspensefulrealisticfunnygritty
Cast
| Cast | Year | Reported Salary | Inflation Adjusted | Notes |
|---|---|---|---|---|
| Cathianne Blore | 1986 | $320,000 | $916,000 | (est) |
| Dom DeLuise | 1986 | $197,000 | $564,000 | (est) |
| John Finnegan | 1986 | $148,000 | $425,000 | (est) |
| Phillip Glasser | 1986 | $121,000 | $347,000 | (est) |
| Amy Green | 1986 | $104,000 | $297,000 | (est) |
| Madeline Kahn | 1986 | $91,000 | $261,000 | (est) |
| Pat Musick | 1986 | $82,000 | $235,000 | (est) |
| Nehemiah Persoff | 1986 | $75,000 | $214,000 | (est) |
| Christopher Plummer | 1986 | $69,000 | $197,000 | (est) |
| Neil Ross | 1986 | $64,000 | $183,000 | (est) |
| Will Ryan | 1986 | $60,000 | $171,000 | (est) |
| Hal Smith | 1986 | $56,000 | $161,000 | (est) |
| Erica Yohn | 1986 | $53,000 | $152,000 | (est) |
Aggregated Reviews
Rotten Tomatoes critic score76.0
RT critic review count86
Rotten Tomatoes audience score71.0
RT audience rating count250,000
IMDb rating6.9
IMDb votes60,534
Box Office ?
| Category | Year | Reported | Inflation Adjusted |
|---|---|---|---|
| Domestic | 1986 | $47,483,002 | $135,907,096 |
| International | 1986 | N/A | N/A |
| Worldwide | 1986 | $47,483,002 | $135,907,096 |
Earnings / Profitability
| Category | Year | Reported | Inflation Adjusted |
|---|---|---|---|
| Revenues | |||
| Theatrical Net Revenue | 1986 | $23,741,501 | $67,953,548 |
| Digital Rentals ? | 1986 | N/A | N/A |
| Digital Purchases ? | 1986 | N/A | N/A |
| Physical Rentals ? | 1986 | $30,376,000 | $86,942,985 |
| Physical Purchases ? | 1986 | $13,043,000 | $37,332,017 |
| TV & Streaming Revenue | 1986 | $11,870,750 | $33,976,774 |
| Total Revenues | 1986 | $79,031,252 | $226,205,325 |
| Expenses | |||
| Budget ? | 1986 | $9,000,000 | $25,760,036 |
| Print & Advertising (P&A) ? source | 1986 | $45,000,000 | $128,800,182 |
| Participations | 1986 | $3,161,000 | $9,047,497 |
| Residuals ? | 1986 | $3,774,000 | $10,802,042 |
| Interest & Overhead | 1986 | $1,800,000 | $5,152,007 |
| Total Expenses | 1986 | $62,735,000 | $179,561,766 |
| Movie Net Profit or Loss | 1986 | $16,296,252 | $46,643,559 |
Similar Movies
| Poster | Movie | Year | Match | Overall | Est. Profit |
|---|---|---|---|---|---|
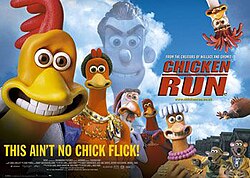 | Chicken Run | 2000 | Shared genres: 7 | 91.3 | $77,924,960 |
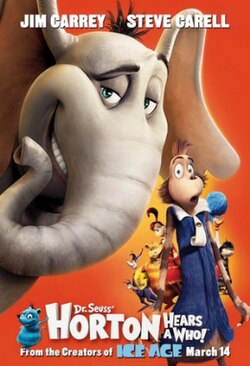 | Horton Hears a Who! | 2008 | Shared genres: 7 | 90.4 | $27,161,306 |
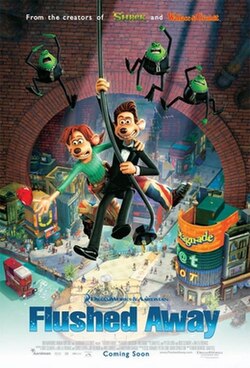 | Flushed Away | 2006 | Shared genres: 7 | 88.6 | $-68,209,393 |
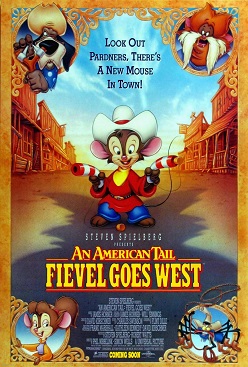 | An American Tail: Fievel Goes West | 1991 | Shared genres: 7 | 80.4 | $41,473,531 |
 | The Muppets Take Manhattan | 1984 | Shared genres: 7 | 75.0 | $20,556,027 |