Synopsis
The crew of a colony ship, bound for a remote planet, discover an uncharted paradise with a threat beyond their imagination, and must attempt a harrowing escape.
Scores
Overall Score
88.9
Popularity Percentile (Year)
97.1%
Box Office Percentile (Year)
94.3%
Review Aggregate
61.2
Critic Consensus
Critic reception is mixed, with 59% of 250 logged reviews marked Fresh. Across reviews, critics repeatedly emphasize thin plot, scary, visually striking. Common reservations focus on thin plot, even when reviewers praise standout elements.
thin plotscaryvisually strikingsuspensefuldarkmacabreemotionalcharacter-drivenstylizedfunny
Cast
| Cast | Year | Reported Salary | Inflation Adjusted | Notes |
|---|---|---|---|---|
| Michael Fassbender | 2017 | $8,368,000 | $10,710,000 | (est) |
| Katherine Waterston | 2017 | $5,151,000 | $6,593,000 | (est) |
| Billy Crudup | 2017 | $3,878,000 | $4,964,000 | (est) |
| Danny McBride | 2017 | $3,171,000 | $4,058,000 | (est) |
| Demián Bichir | 2017 | $2,712,000 | $3,471,000 | (est) |
Aggregated Reviews
Rotten Tomatoes critic score65.0
RT critic review count408
Rotten Tomatoes audience score55.0
RT audience rating count50,000
IMDb rating6.4
IMDb votes335,885
Box Office ?
| Category | Year | Reported | Inflation Adjusted |
|---|---|---|---|
| Domestic | 2017 | $74,262,030 | $95,046,920 |
| International | 2017 | $166,629,730 | $213,267,030 |
| Worldwide | 2017 | $240,891,760 | $308,313,950 |
Earnings / Profitability
| Category | Year | Reported | Inflation Adjusted |
|---|---|---|---|
| Revenues | |||
| Theatrical Net Revenue | 2017 | $103,782,907 | $132,830,272 |
| Digital Rentals ? | 2017 | $4,661,000 | $5,965,548 |
| Digital Purchases ? | 2017 | $5,201,000 | $6,656,686 |
| Physical Rentals ? | 2017 | $3,477,000 | $4,450,163 |
| Physical Purchases ? | 2017 | $9,986,000 | $12,780,940 |
| TV & Streaming Revenue | 2017 | $18,565,508 | $23,761,730 |
| Total Revenues | 2017 | $145,673,414 | $186,445,339 |
| Expenses | |||
| Budget ? | 2017 | $97,000,000 | $124,148,925 |
| Print & Advertising (P&A) ? | 2017 | $42,783,000 (est) | $54,757,355 (est) |
| Participations | 2017 | $2,913,000 | $3,728,307 |
| Residuals ? | 2017 | $2,177,000 | $2,786,311 |
| Interest & Overhead | 2017 | $14,550,000 | $18,622,339 |
| Total Expenses | 2017 | $159,423,000 | $204,043,239 |
| Movie Net Profit or Loss | 2017 | $-13,749,586 | $-17,597,900 |
Similar Movies
| Poster | Movie | Year | Match | Overall | Est. Profit |
|---|---|---|---|---|---|
 | Alien vs. Predator | 2004 | Shared franchise (1) | 82.0 | $42,918,615 |
 | Aliens | 1986 | Shared franchise (1) | 96.9 | $60,886,184 |
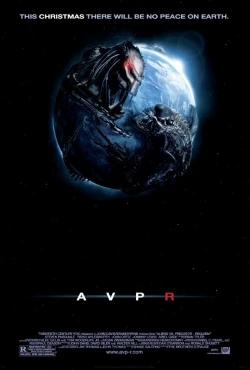 | Aliens vs. Predator: Requiem | 2007 | Shared franchise (1) | 73.4 | $30,315,324 |
 | Alien: Romulus | 2024 | Shared franchise (1) | 94.2 | $32,312,722 |
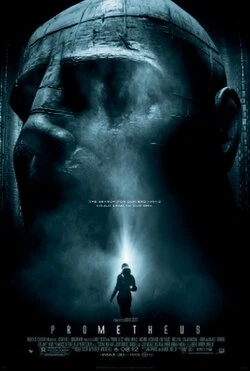 | Prometheus | 2012 | Shared franchise (1) | 92.3 | $20,846,082 |