Synopsis
John McClane travels to Russia to help out his seemingly wayward son, Jack, only to discover that Jack is a CIA operative working undercover, causing the father and son to team up against underworld forces.
Scores
Overall Score
82.1
Popularity Percentile (Year)
92.8%
Box Office Percentile (Year)
96.5%
Review Aggregate
33.0
Critic Consensus
Critic reception is largely negative, with 15% of 229 logged reviews marked Fresh. Across reviews, critics repeatedly emphasize thin plot, family-friendly, funny. Many reviews cite pacing issues, thin plot as the main reasons it falls short.
thin plotfamily-friendlyfunnyaction-packedpacing issuespoliticalstylizedsuspensefultragiccharacter-driven
Cast
| Cast | Year | Reported Salary | Inflation Adjusted | Notes |
|---|---|---|---|---|
| Bruce Willis | 2013 | $25,000,000 source | $33,658,798 | reported |
| Jai Courtney | 2013 | $3,821,000 | $5,145,000 | (est) |
| Sebastian Koch | 2013 | $2,877,000 | $3,874,000 | (est) |
| Yulia Snigir | 2013 | $2,352,000 | $3,167,000 | (est) |
| Rasha Bukvić | 2013 | $2,012,000 | $2,709,000 | (est) |
| Cole Hauser | 2013 | $1,771,000 | $2,384,000 | (est) |
| Amaury Nolasco | 2013 | $1,590,000 | $2,141,000 | (est) |
| Sergei Kolesnikov | 2013 | $1,448,000 | $1,950,000 | (est) |
Aggregated Reviews
Rotten Tomatoes critic score15.0
RT critic review count229
Rotten Tomatoes audience score40.0
RT audience rating count100,000
IMDb rating5.2
IMDb votes220,566
Box Office ?
| Category | Year | Reported | Inflation Adjusted |
|---|---|---|---|
| Domestic | 2013 | $67,349,198 | $90,675,723 |
| International | 2013 | $237,304,984 | $319,496,024 |
| Worldwide | 2013 | $304,654,182 | $410,171,746 |
Earnings / Profitability
| Category | Year | Reported | Inflation Adjusted |
|---|---|---|---|
| Revenues | |||
| Theatrical Net Revenue | 2013 | $128,596,593 | $173,136,271 |
| Digital Rentals ? | 2013 | $5,036,000 | $6,780,228 |
| Digital Purchases ? | 2013 | $3,011,000 | $4,053,866 |
| Physical Rentals ? | 2013 | $6,510,000 | $8,764,751 |
| Physical Purchases ? | 2013 | $16,867,000 | $22,708,918 |
| TV & Streaming Revenue | 2013 | $16,837,300 | $22,668,931 |
| Total Revenues | 2013 | $176,857,892 | $238,112,965 |
| Expenses | |||
| Budget ? | 2013 | $92,000,000 | $123,864,378 |
| Print & Advertising (P&A) ? | 2013 | $42,310,000 (est) | $56,964,150 (est) |
| Participations | 2013 | $14,149,000 | $19,049,533 |
| Residuals ? | 2013 | $2,814,000 | $3,788,634 |
| Interest & Overhead | 2013 | $13,800,000 | $18,579,657 |
| Total Expenses | 2013 | $165,073,000 | $222,246,352 |
| Movie Net Profit or Loss | 2013 | $11,784,892 | $15,866,612 |
Similar Movies
| Poster | Movie | Year | Match | Overall | Est. Profit |
|---|---|---|---|---|---|
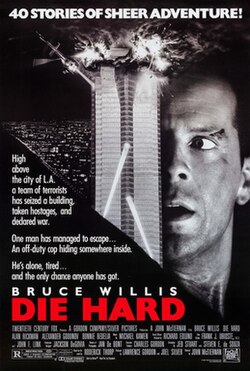 | Die Hard | 1988 | Shared franchise (1) | 97.0 | $58,193,580 |
 | Live Free or Die Hard | 2007 | Shared franchise (1) | 94.4 | $59,195,578 |
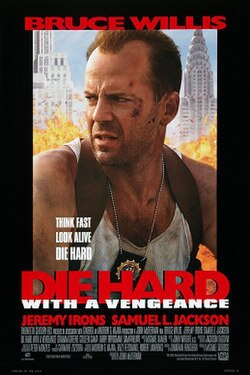 | Die Hard with a Vengeance | 1995 | Shared franchise (1) | 92.0 | $34,218,749 |
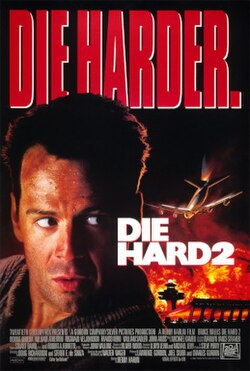 | Die Hard 2 | 1990 | Shared franchise (1) | 91.5 | $55,359,965 |
 | The Dark Knight | 2008 | Shared genres: 3 | 98.6 | $250,967,554 |