Movie Box Office and Profits
Cumulative WW Box Office$6,175,128,848
Cumulative Profit$1,500,195,087
Cumulative Domestic Box Office$2,516,807,830
Average WW Box Office$162,503,391
Average Domestic Box Office$66,231,785
Average Profit / Loss Per Film$39,478,818
Filmography
| Poster | Movie | Year | Roles | Overall Score | Worldwide | Profit |
|---|---|---|---|---|---|---|
 | Clown in a Cornfield | 2025 | Production Company | 69.7 | $13,850,731 | $15,203,192 |
 | Smile 2 | 2024 | Production Company | 90.2 | $138,128,850 | $27,692,946 |
 | CatVideoFest 2022 | 2022 | Production Company | 47.8 | $217,330 | $-11,928,670 |
 | On the Come Up | 2022 | Production Company | 40.1 | $236,153 | $7,631,345 |
 | Smile | 2022 | Production Company | 90.7 | $217,408,510 | $81,650,673 |
 | The Runner | 2022 | Production Company | 55.8 | $34,834 | $-25,806,583 |
 | Jihadists | 2019 | Production Company | 17.3 | $2,104 | $-250,948 |
 | Maze | 2019 | Production Company | 57.6 | $44,381 | $-26,463,810 |
 | First Man | 2018 | Production Company | 90.9 | $105,697,416 | $-44,067,243 |
 | Life Itself | 2018 | Production Company | 69.7 | $7,997,774 | $-292,566 |
 | Love, Simon | 2018 | Production Company | 90.0 | $66,316,288 | $13,733,734 |
 | Maze Runner: The Death Cure | 2018 | Production Company | 86.7 | $288,175,330 | $26,991,493 |
 | The Hate U Give | 2018 | Production Company | 83.4 | $34,934,008 | $-18,450,771 |
 | Uncle Drew | 2018 | Production Company | 73.2 | $46,664,416 | $3,103,245 |
 | Power Rangers | 2017 | Production Company | 83.3 | $142,337,250 | $-45,833,546 |
 | Maze Runner: The Scorch Trials | 2015 | Production Company | 87.9 | $312,296,060 | $48,856,436 |
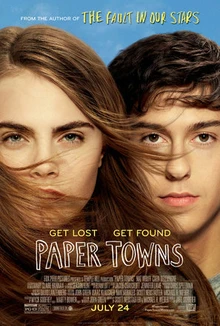
 | Paper Towns | 2015 | Production Company | 81.7 | $85,512,304 | $33,067,026 |
 | The Longest Ride | 2015 | Production Company | 80.4 | $62,944,816 | $-2,601,934 |
 | The Fault in Our Stars | 2014 | Production Company | 93.3 | $307,166,850 | $137,521,225 |
 | The Maze Runner | 2014 | Production Company | 90.9 | $348,319,870 | $89,043,698 |
 | A Good Day to Die Hard | 2013 | Production Company | 82.1 | $304,654,180 | $11,784,896 |
 | Runner Runner | 2013 | Production Company | 79.3 | $62,675,096 | $2,041,697 |
 | Safe Haven | 2013 | Production Company | 78.4 | $97,594,144 | $23,448,848 |
 | 10 Years | 2012 | Production Company | 54.5 | $278,336 | $13,774,990 |
 | The Twilight Saga: Breaking Dawn - Part 2 | 2012 | Production Company | 89.5 | $829,746,800 | $201,719,137 |
 | A Good Day to Die | 2011 | Production Company | 42.3 | $573 | $-193,714 |
 | Everything Must Go | 2011 | Production Company | 63.8 | $2,820,490 | $16,272,018 |
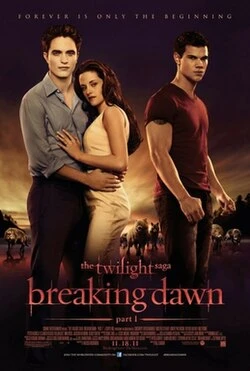 | The Twilight Saga: Breaking Dawn - Part 1 | 2011 | Production Company | 85.9 | $712,205,800 | $178,278,457 |
 | Dear John | 2010 | Production Company | 82.3 | $114,991,720 | $46,898,060 |
 | The Eclipse | 2010 | Production Company | 62.4 | $159,852 | $11,966,987 |
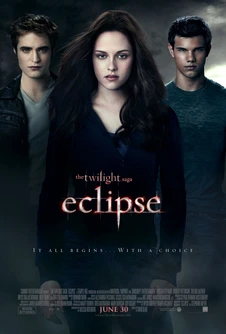
 | The Twilight Saga: Eclipse | 2010 | Production Company | 88.1 | $698,491,300 | $233,606,811 |
 | Twilight/New Moon | 2010 | Production Company | 73.3 | $2,385,237 | $-27,556,287 |
 | Management | 2009 | Production Company | 56.3 | $2,555,950 | $20,464,309 |
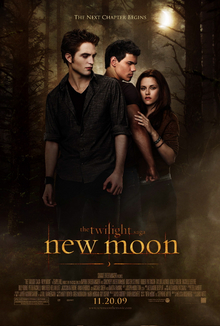
 | The Twilight Saga: New Moon | 2009 | Production Company | 86.4 | $709,827,460 | $281,760,638 |
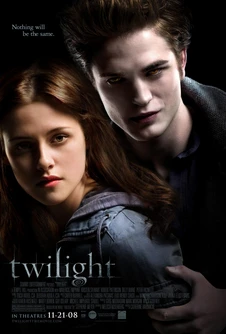 | Twilight | 2008 | Production Company | 90.2 | $407,261,540 | $157,209,635 |
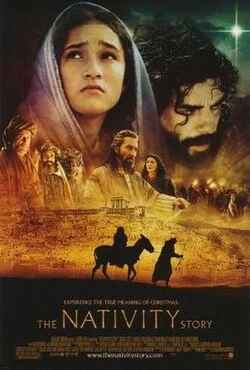 | The Nativity Story | 2006 | Production Company | 70.5 | $46,432,264 | $2,264,347 |
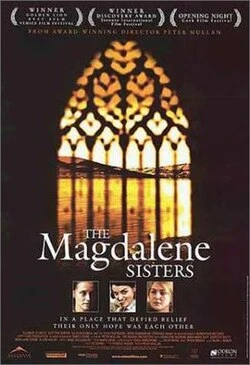 | The Magdalene Sisters | 2003 | Production Company | 66.9 | $4,734,466 | $27,270,131 |
 | Southpaw | 2000 | Production Company | 39.1 | $28,365 | $-9,614,818 |
Basic Facts
NameTemple Hill Entertainment
TypeCompany
Role(s)
Production Company
Films in database38
Years in database2000-2025
Role counts
Production Company: 38
Movie Data
Average Movie Score72.9
Movie Score Min17.3
Movie Score Max93.3