
Tencent Pictures
Dynamic entity page generated from imported ScreenProfits movie metadata.
Production Company
Movies9
Years2017-2023
Avg Score77.8
Worldwide Gross$2,305,203,886
Associated Movies
| Poster | Movie | Year | Overall | Popularity % | Box Office % | Worldwide | Profit/Loss (Est.) | Profit (Inflation Adj) |
|---|---|---|---|---|---|---|---|---|

|
2018 | 93.0 | 95.2% | 97.8% | $468M | -$2M | $2M | |

|
2017 | 92.3 | 97.4% | 97.8% | $569M | -$24M | -$25M | |

|
2019 | 89.2 | 90.5% | 88.1% | $68M | $1M | $3M | |
|
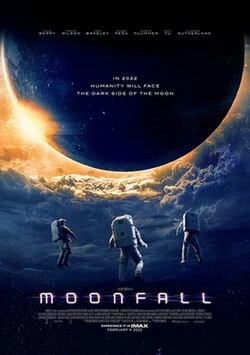
2022 | 80.8 | 87.9% | 88.6% | $67M | -$166M | -$178M | |

|
The Eight Hundred
COVID-era
|
2020 | 77.2 | 58.5% | 99.8% | $461M | $70M | $90M |

|
Raging Fire
Recovery period
|
2021 | 74.0 | 51.8% | 95.0% | $206M | $41M | $48M |

|
2023 | 72.3 | 53.8% | 96.1% | $373M | -$769M | -$790M | |

|
Vanguard
COVID-era
|
2020 | 67.0 | 56.8% | 94.7% | $51M | -$23M | -$29M |
|
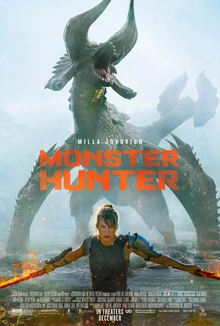
Monster Hunter
COVID-era
|
2020 | 54.3 | 24.2% | 92.0% | $42M | -$50M | -$60M |