
CMC Pictures
Dynamic entity page generated from imported ScreenProfits movie metadata.
Distributor
Studio
Production Company
Movies21
Years2019-2025
Avg Score61.5
Worldwide Gross$7,907,280,928
Associated Movies
| Poster | Movie | Year | Overall | Popularity % | Box Office % | Worldwide | Profit/Loss (Est.) | Profit (Inflation Adj) |
|---|---|---|---|---|---|---|---|---|

|
2025 | 84.6 | 69.9% | 99.9% | $2B | $147M | $147M | |

|
2019 | 82.6 | 80.1% | 98.3% | $700M | $174M | $220M | |
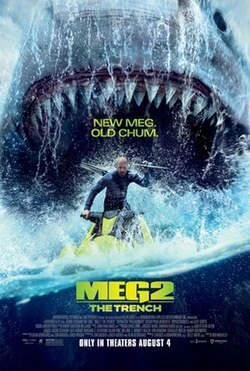
|
2023 | 82.1 | 85.8% | 96.5% | $398M | -$37M | -$36M | |

|
The Eight Hundred
COVID-era
|
2020 | 77.2 | 58.5% | 99.8% | $461M | $70M | $90M |

|
2023 | 71.4 | 44.4% | 97.6% | $488M | $99M | $105M | |

|
A Writer's Odyssey
COVID-era
|
2021 | 69.0 | 45.9% | 92.9% | $150M | -$31M | -$37M |

|
The Battle at Lake Changjin
Recovery period
|
2021 | 67.7 | 44.8% | 99.6% | $903M | $84M | $106M |

|
2019 | 67.6 | 43.8% | 97.8% | $450M | $81M | $102M | |

|
Cliff Walkers
COVID-era
|
2021 | 65.0 | 38.4% | 94.4% | $181M | $3M | $4M |

|
2022 | 62.6 | 35.9% | 98.0% | $627M | $150M | $165M | |

|
2019 | 61.2 | 37.7% | 94.3% | $189M | $34M | $43M | |

|
2019 | 56.1 | 27.3% | 91.3% | $118M | $10M | $13M | |

|
2025 | 54.4 | 36.7% | 63.3% | $500M | $169M | $169M | |

|
My Country, My Parents
Recovery period
|
2021 | 53.4 | 17.2% | 95.7% | $222M | $15M | $17M |

|
My Love
COVID-era
|
2021 | 52.8 | 18.7% | 90.8% | $117M | -$10M | -$12M |

|
2025 | 52.2 | 35.1% | 59.4% | $4M | -$136M | -$136M | |

|
Anita
Recovery period
|
2021 | 51.0 | 23.9% | 76.1% | $15M | -$29M | -$35M |
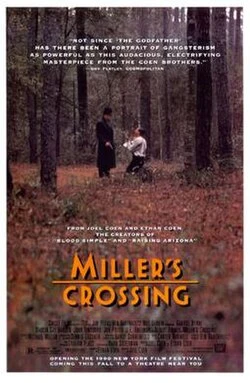
|
2019 | 50.4 | 34.8% | 60.3% | $2M | -$16M | -$20M | |

|
2019 | 50.2 | 19.6% | 82.1% | $31M | -$46M | -$58M | |

|
End Game
COVID-era
|
2021 | 49.0 | 22.9% | 90.1% | $92M | -$107M | -$124M |

|
2022 | 31.5 | 19.1% | 34.1% | $129K | -$287K | -$316K |