
20th Century Studios
Dynamic entity page generated from imported ScreenProfits movie metadata.
Studio
Distributor
Production Company
Movies34
Years2006-2026
Avg Score79.0
Worldwide Gross$7,421,866,582
Associated Movies
| Poster | Movie | Year | Overall | Popularity % | Box Office % | Worldwide | Profit/Loss (Est.) | Profit (Inflation Adj) |
|---|---|---|---|---|---|---|---|---|

|
2022 | 95.8 | 99.0% | 99.9% | $2B | $19M | $34M | |

|
Free Guy
Recovery period
|
2021 | 94.9 | 98.8% | 96.8% | $332M | $23M | $31M |

|
2024 | 94.2 | 98.8% | 96.6% | $351M | $45M | $48M | |

|
2006 | 93.2 | 97.9% | 98.1% | $327M | $112M | $180M | |
| 2025 | 91.3 | 94.4% | 90.6% | $185M | -$8M | -$8M | ||

|
2024 | 91.3 | 93.6% | 97.1% | $397M | -$12M | -$8M | |

|
2020 | 89.1 | 91.0% | 95.8% | $111M | -$85M | -$102M | |

|
West Side Story
Recovery period
|
2021 | 88.3 | 88.8% | 88.8% | $76M | -$78M | -$89M |
|
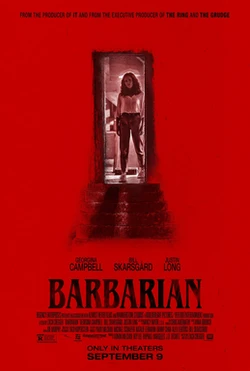
2022 | 88.2 | 94.1% | 86.0% | $45M | $25M | $28M | |

|
2022 | 88.1 | 93.0% | 92.5% | $137M | -$56M | -$59M | |

|
2023 | 87.6 | 95.3% | 87.9% | $104M | -$64M | -$66M | |

|
The Last Duel
Recovery period
|
2021 | 87.1 | 93.4% | 82.8% | $31M | -$99M | -$115M |

|
2023 | 86.6 | 90.2% | 89.6% | $122M | -$29M | -$29M | |

|
The King's Man
Recovery period
|
2021 | 85.7 | 92.6% | 91.3% | $126M | -$60M | -$68M |
|
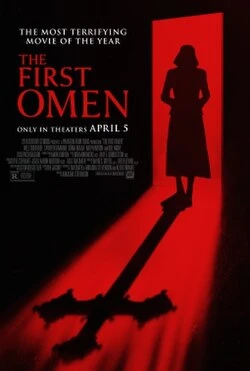
2024 | 84.9 | 86.8% | 89.0% | $54M | -$21M | -$20M | |
|
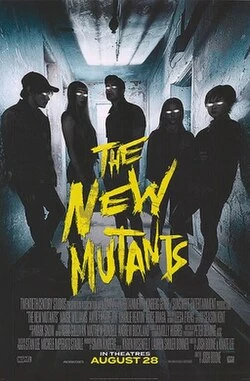
The New Mutants
COVID-era
|
2020 | 84.3 | 93.4% | 93.7% | $49M | -$68M | -$81M |
| 2025 | 84.2 | 88.9% | 85.6% | $96M | -$15M | -$15M | ||

|
Ron's Gone Wrong
Recovery period
|
2021 | 83.0 | 78.9% | 88.0% | $61M | -$77M | -$91M |

|
2023 | 82.1 | 96.5% | 56.8% | $2M | -$31M | -$32M | |
|
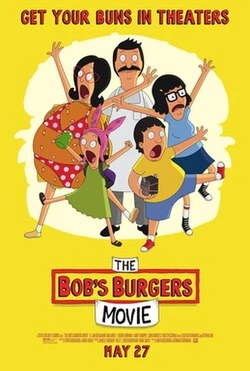
2022 | 79.1 | 72.6% | 84.9% | $34M | -$27M | -$28M | |

|
2023 | 79.1 | 81.4% | 85.8% | $67M | -$15M | -$15M | |
|
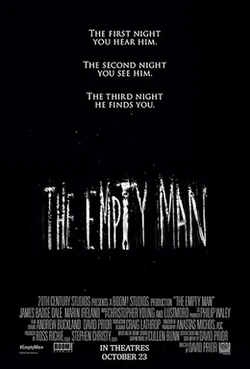
The Empty Man
COVID-era
|
2020 | 79.0 | 86.3% | 76.4% | $5M | -$16M | -$20M |

|
2022 | 78.4 | 87.2% | 83.9% | $31M | -$82M | -$88M | |

|
The Call
COVID-era
|
2020 | 77.6 | 87.6% | 66.6% | $2M | -$168M | -$204M |
| 2025 | 75.5 | 75.0% | 79.4% | $45M | -$36M | -$36M | ||

|
2020 | 57.4 | 73.4% | 39.8% | $229K | -$90M | -$109M | |
| 2025 | 54.3 | 55.2% | 60.0% | $4M | -$37M | -$37M | ||
|
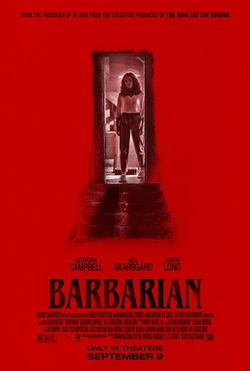
2022 | 41.5 | 50.2% | 12.1% | $14K | -$5M | -$5M | |
|
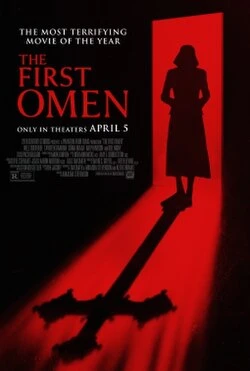
2024 | 35.7 | 36.9% | 13.2% | $30K | -$34M | -$34M | |
|
2019 | 32.0 | 33.3% | 8.4% | $11K | -$5M | -$6M | |

|
2026 | N/A | N/A | N/A | $1B | $698M | $0 | |

|
2026 | N/A | N/A | N/A | $94M | -$13M | $0 | |

|
2026 | N/A | N/A | N/A | $693M | $154M | $0 | |

|
2026 | N/A | N/A | N/A | $34M | $18M | $0 |