Movie Box Office and Profits
Cumulative WW Box Office$1,268,062,466
Cumulative Profit$431,414,742
Cumulative Domestic Box Office$1,009,096,985
Average WW Box Office$37,295,955
Average Domestic Box Office$29,679,323
Average Profit / Loss Per Film$12,688,669
Filmography
| Poster | Movie | Year | Roles | Overall Score | Worldwide | Profit |
|---|---|---|---|---|---|---|
 | Pavarotti | 2019 | Production Company | 67.0 | $8,083,942 | $9,166,501 |
 | The Only Real Game | 2014 | Studio | 55.0 | $5,384 | $971,692 |
 | Breakdance Academy | 2013 | Production Company | 48.2 | $12,708 | $-2,356,646 |
 | Beyond the Clouds | 1999 | Studio | 28.7 | $31,738 | $4,366,869 |
 | Late August, Early September | 1999 | Studio | 31.4 | $69,400 | $-21,105,600 |
 | Plunkett & Macleane | 1999 | Studio | 45.2 | $474,900 | $6,581,908 |
 | Artemisia | 1998 | Studio | 28.1 | $356,749 | $1,009,209 |
 | Barney's Great Adventure | 1998 | Distributor | 38.3 | $12,218,638 | $15,074,792 |
 | Return to Paradise | 1998 | Distributor | 55.3 | $8,341,087 | $14,145,404 |
 | The Borrowers | 1998 | Distributor | 65.1 | $22,619,588 | $17,767,691 |
 | The Gingerbread Man | 1998 | Distributor | 40.5 | $1,677,131 | $-11,768,582 |
 | The Proposition | 1998 | Distributor | 18.7 | $147,773 | $5,592,384 |
 | Very Bad Things | 1998 | Distributor | 62.1 | $9,898,412 | $905,825 |
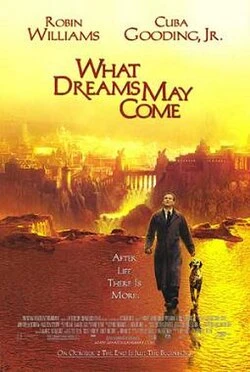 | What Dreams May Come | 1998 | Distributor | 80.8 | $55,382,928 | $-10,864,804 |
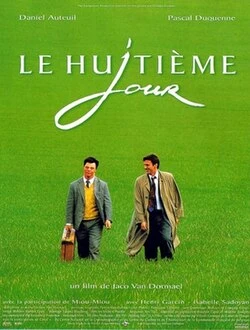 | The Eighth Day | 1997 | Studio | 44.7 | $416,401 | $12,595,489 |
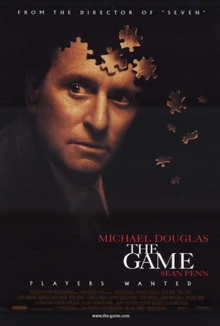 | The Game | 1997 | Distributor, Studio | 88.8 | $48,323,860 | $10,704,820 |
 | The Van | 1997 | Studio | 60.0 | $714,197 | $-61,520,114 |
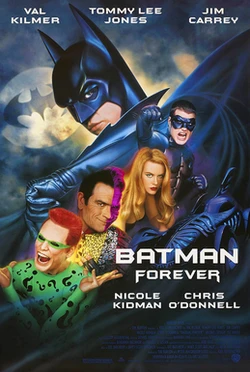 | Batman Forever | 1995 | Production Company | 85.8 | $184,033,490 | $63,888,258 |
 | Batman Returns | 1992 | Production Company | 94.0 | $266,831,700 | $55,072,726 |
 | Drop Dead Fred | 1991 | Production Company | 69.9 | $13,878,564 | $36,525,967 |
 | Chicago Joe and the Showgirl | 1990 | Production Company | 12.8 | $85,395 | $-4,446,605 |
 | Fools of Fortune | 1990 | Production Company | 12.8 | $83,490 | $-1,819,510 |
 | Wild at Heart | 1990 | Production Company | 74.1 | $14,575,558 | $33,229,461 |
 | Batman | 1989 | Production Company | 94.9 | $401,188,930 | $178,429,590 |
 | A Chorus Line | 1985 | Production Company | 58.0 | $14,203,951 | $-5,118,826 |
 | Clue | 1985 | Production Company | 78.9 | $14,644,310 | $9,013,998 |
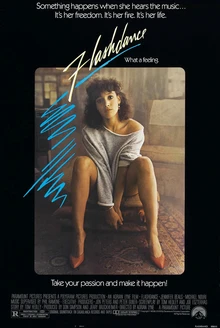 | Flashdance | 1983 | Production Company | 83.5 | $92,921,200 | $69,364,536 |
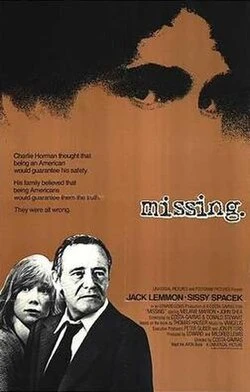 | Missing | 1982 | Production Company | 64.1 | $14,000,000 | $706,000 |
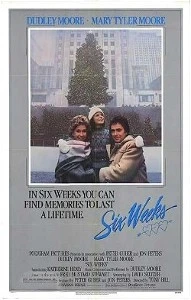 | Six Weeks | 1982 | Production Company | 27.3 | $6,668,025 | $-5,954,662 |
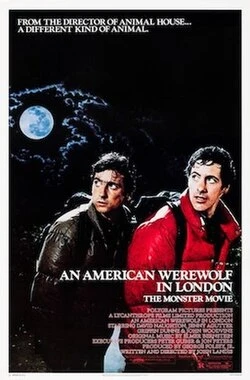 | An American Werewolf in London | 1981 | Production Company | 83.6 | $30,716,820 | $18,437,900 |
 | Endless Love | 1981 | Production Company | 58.4 | $32,492,674 | $11,896,478 |
 | King of the Mountain | 1981 | Production Company | 13.2 | $1,791,147 | $-1,877,968 |
 | The Pursuit of D.B. Cooper | 1981 | Production Company | 17.8 | $3,702,028 | $-13,405,499 |
 | Foxes | 1980 | Production Company | 48.9 | $7,470,348 | $-3,793,942 |
Basic Facts
Namepolygram film distribution france
TypeCompany
Role(s)
Distributor
Production Company
Studio
Films in database34
Years in database1980-2019
Role counts
Production Company: 19
Distributor: 8
Studio: 8
Movie Data
Average Movie Score54.0
Movie Score Min12.8
Movie Score Max94.9