Synopsis
There are over 20,000 wildfires in a typical year; we follow crews to a few of them. First, we see the preseason physical training and a prescribed burn, which burns the flammable underbrush before the trees themselves are flammable. But since these burns can't do the whole job, we see how firespotters pinpoint lighting-caused fires that smokejumpers then have to parachute into. In the open wilderness of Idaho, the job is relatively simple. In California, where forests are closer to civilization and the chaparral forests are much more flammable, access to the fire is easier, but fighting it is harder. And in Australia, where the forests are full of eucalyptus and tea, the flammability is compounded by the acrid smoke.
Scores
Popularity Percentile (Year)
2.3%
Box Office Percentile (Year)
50.4%
Critic Consensus
N/A • 0 critic reviews
No professional critic quote data was available to synthesize a consensus summary.
No tags
Cast
| Cast | Year | Reported Salary | Inflation Adjusted | Notes |
|---|
| N/A |
Aggregated Reviews
Rotten Tomatoes critic scoreN/A
RT critic review count0
Rotten Tomatoes audience scoreN/A
RT audience rating count100
IMDb rating6.4
IMDb votes96
Box Office ?
| Category | Year | Reported | Inflation Adjusted |
|---|
| Domestic | 1999 | $2,040,635 | $3,842,420 |
| International | 1999 | N/A | N/A |
| Worldwide | 1999 | $2,040,635 | $3,842,420 |
Earnings / Profitability
Estimated net revenues and net expenses for films based on reported and estimated numbers. This income statement should be considered most viable for the first 24 months after the inital movie's release (ie after most lucrative pay windows).
| Category | Year | Reported | Inflation Adjusted |
|---|
| Revenues |
| Theatrical Net Revenue | 1999 | $1,020,318 | $1,921,210 |
| Digital Rentals ? | 1999 | N/A | N/A |
| Digital Purchases ? | 1999 | N/A | N/A |
| Physical Rentals ? | 1999 | $9,348,000 | $17,601,846 |
| Physical Purchases ? | 1999 | $12,083,000 | $22,751,723 |
| TV & Streaming Revenue | 1999 | $816,254 | $1,536,968 |
| Total Revenues | 1999 | $23,267,572 | $43,811,748 |
| Expenses |
| Budget ? | 1999 | $1,087,000 (est) | $2,046,770 (est) |
| Print & Advertising (P&A) ? | 1999 | $778,000 (est) | $1,464,938 (est) |
| Participations | 1999 | $931,000 | $1,753,029 |
| Residuals ? | 1999 | $1,616,000 | $3,042,852 |
| Interest & Overhead | 1999 | $217,400 | $409,354 |
| Total Expenses | 1999 | $4,629,400 | $8,716,943 |
| Movie Net Profit or Loss | 1999 | $18,638,172 | $35,094,804 |
Similar Movies
| Poster | Movie | Year | Match | Overall | Est. Profit |
|---|
 | Pandas | 2018 | Shared genres: 3 | 80.3 | $18,834,396 |
 | Island of the Sharks | 1999 | Shared genres: 3 | 72.6 | $34,007,894 |
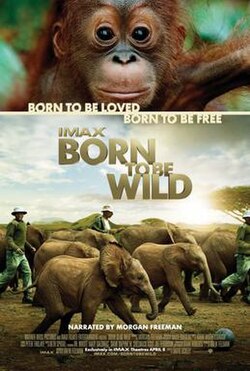 | Born to Be Wild | 2011 | Shared genres: 3 | 65.2 | $19,398,499 |
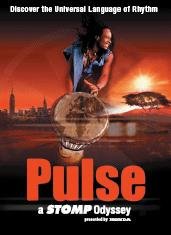 | Pulse: A Stomp Odyssey | 2002 | Shared genres: 3 | 65.0 | $33,570,820 |
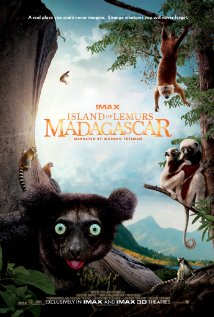 | Island of Lemurs: Madagascar | 2014 | Shared genres: 3 | 62.6 | $12,890,766 |
Tooltips
- Budget Estimated using Machine Learning
- Digital Rentals: PVOD, VOD, & On-Demand
- Marketing & distribution costs to release Movie in Theaters. Includes: Online & Offline Ads, Posters, Trailer Production, and physical or digital copies (formerly "prints") sent to cinemas.
- Net Digital Purchase Revenue
- Net Revenues for Physical Rentals: VHS, DVD, BluRay (when appropriate)
- Physical Purchases: VHS $9,718,000, DVD $2,365,000, BluRay $0
- Reported or Estimated Net Budget (after tax, product placements, & grants)
- Theatrical box office grosses split into Domestic, International, and Worldwide totals.
- Union-modeled residuals using SAG-AFTRA and WGA schedules as a simplified estimate proxy.
- reestimate_prior_estimate;covid_mult=1.00;peer_count=0;reg_box_pred=700222;reg_main_pred=993972
Budget Tooltip
Reported or Estimated Net Budget (after tax, product placements, & grants)
Comments
No approved comments yet.