Synopsis
Actors Steve Coogan and Rob Brydon embark on a six-part episodic road trip through Europe. This time they're in Spain, sampling the restaurants, eateries, and sights along the way.
Scores
Overall Score
57.9
Popularity Percentile (Year)
52.8%
Box Office Percentile (Year)
56.4%
Review Aggregate
71.8
Critic Consensus
Critic reception is largely positive, with 83% of 106 logged reviews marked Fresh. Across reviews, critics repeatedly emphasize funny, lighthearted, visually striking. Most critics frame the film as an effective delivery of its core style and intent.
funnylightheartedvisually strikingfamily-friendlyemotionalupliftingchristmasgritty
Cast
| Cast | Year | Reported Salary | Inflation Adjusted | Notes |
|---|---|---|---|---|
| Rob Brydon | 2017 | $43,000 | $55,000 | (est) |
| Steve Coogan | 2017 | $27,000 | $34,000 | (est) |
Aggregated Reviews
Rotten Tomatoes critic score83.0
RT critic review count106
Rotten Tomatoes audience score63.0
RT audience rating count1,000
IMDb rating6.6
IMDb votes6,634
Box Office ?
| Category | Year | Reported | Inflation Adjusted |
|---|---|---|---|
| Domestic | 2017 | $1,157,604 | $1,481,601 |
| International | 2017 | $831,237 | $1,063,888 |
| Worldwide | 2017 | $1,988,841 | $2,545,489 |
Earnings / Profitability
| Category | Year | Reported | Inflation Adjusted |
|---|---|---|---|
| Revenues | |||
| Theatrical Net Revenue | 2017 | $911,297 | $1,166,356 |
| Digital Rentals ? | 2017 | $2,641,000 | $3,380,178 |
| Digital Purchases ? | 2017 | $2,947,000 | $3,771,823 |
| Physical Rentals ? | 2017 | $1,970,000 | $2,521,375 |
| Physical Purchases ? | 2017 | $5,658,000 | $7,241,594 |
| TV & Streaming Revenue | 2017 | $463,042 | $592,640 |
| Total Revenues | 2017 | $14,590,338 | $18,673,966 |
| Expenses | |||
| Budget ? | 2017 | $911,000 (est) | $1,165,976 (est) |
| Print & Advertising (P&A) ? | 2017 | $946,000 (est) | $1,210,772 (est) |
| Participations | 2017 | $584,000 | $747,453 |
| Residuals ? | 2017 | $747,000 | $956,075 |
| Interest & Overhead | 2017 | $182,200 | $233,195 |
| Total Expenses | 2017 | $3,370,200 | $4,313,471 |
| Movie Net Profit or Loss | 2017 | $11,220,138 | $14,360,495 |
Similar Movies
| Poster | Movie | Year | Match | Overall | Est. Profit |
|---|---|---|---|---|---|
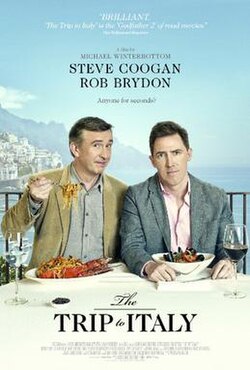 | The Trip to Italy | 2014 | Shared franchise (1) | 65.1 | $18,478,912 |
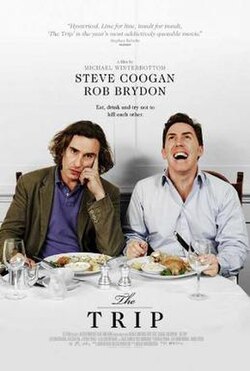 | The Trip | 2011 | Shared franchise (1) | 62.9 | $18,721,960 |
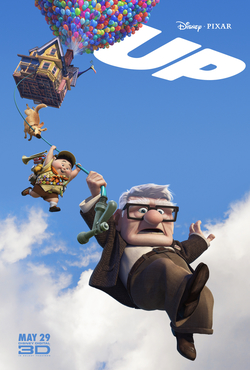 | Up | 2009 | Shared genres: 3 | 97.7 | $103,203,507 |
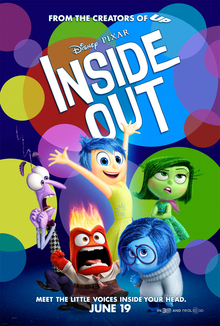 | Inside Out | 2015 | Shared genres: 3 | 97.4 | $115,137,542 |
 | Inside Out 2 | 2024 | Shared genres: 3 | 96.0 | $435,979,614 |