Synopsis
Brian, painter Ellen and chef Sam timeshare an apartment on different days. A shift on Mon/Wednesdays causes mistaken identity as Ellen and Sam have never met but leave notes, food etc. behind for each other.
Scores
Overall Score
27.8
Popularity Percentile (Year)
16.5%
Box Office Percentile (Year)
28.2%
Review Aggregate
52.5
Critic Consensus
Critic reception is largely positive, with 100% of 3 logged reviews marked Fresh. Across reviews, critics repeatedly emphasize romantic, funny, character-driven. Most critics frame the film as an effective delivery of its core style and intent.
romanticfunnycharacter-drivenemotionalvisually strikingthought-provoking
Cast
| Cast | Year | Reported Salary | Inflation Adjusted | Notes |
|---|---|---|---|---|
| Matthew Broderick | 1993 | $460,000 | $999,000 | (est) |
| Annabella Sciorra | 1993 | $283,000 | $615,000 | (est) |
| Kevin Anderson | 1993 | $213,000 | $463,000 | (est) |
| Jeanne Tripplehorn | 1993 | $174,000 | $378,000 | (est) |
| Justine Bateman | 1993 | $149,000 | $324,000 | (est) |
Aggregated Reviews
Rotten Tomatoes critic score63.0
RT critic review count8
Rotten Tomatoes audience score35.0
RT audience rating count250
IMDb rating6.0
IMDb votes3,093
Box Office ?
| Category | Year | Reported | Inflation Adjusted |
|---|---|---|---|
| Domestic | 1993 | $1,884,814 | $4,091,807 |
| International | 1993 | N/A | N/A |
| Worldwide | 1993 | $1,884,814 | $4,091,807 |
Earnings / Profitability
| Category | Year | Reported | Inflation Adjusted |
|---|---|---|---|
| Revenues | |||
| Theatrical Net Revenue | 1993 | $942,407 | $2,045,904 |
| Digital Rentals ? | 1993 | N/A | N/A |
| Digital Purchases ? | 1993 | N/A | N/A |
| Physical Rentals ? | 1993 | $8,867,000 | $19,249,674 |
| Physical Purchases ? | 1993 | $7,125,000 | $15,467,907 |
| TV & Streaming Revenue | 1993 | $753,926 | $1,636,723 |
| Total Revenues | 1993 | $17,688,333 | $38,400,207 |
| Expenses | |||
| Budget ? | 1993 | $8,000,000 | $17,367,474 |
| Print & Advertising (P&A) ? | 1993 | $1,451,000 (est) | $3,150,026 (est) |
| Participations | 1993 | $708,000 | $1,537,021 |
| Residuals ? | 1993 | $1,211,000 | $2,629,001 |
| Interest & Overhead | 1993 | $1,600,000 | $3,473,495 |
| Total Expenses | 1993 | $12,970,000 | $28,157,017 |
| Movie Net Profit or Loss | 1993 | $4,718,333 | $10,243,190 |
Similar Movies
| Poster | Movie | Year | Match | Overall | Est. Profit |
|---|---|---|---|---|---|
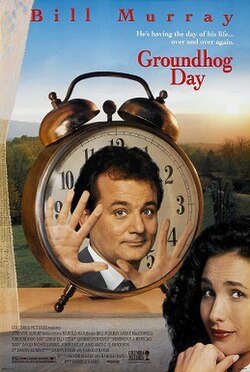 | Groundhog Day | 1993 | Shared genres: 3 | 95.4 | $78,676,439 |
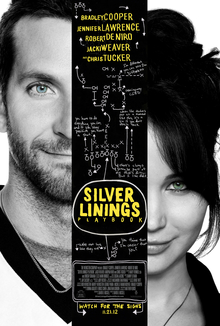 | Silver Linings Playbook | 2012 | Shared genres: 3 | 94.9 | $98,374,305 |
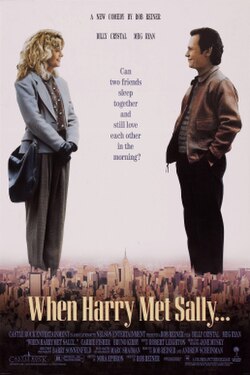 | When Harry Met Sally... | 1989 | Shared genres: 3 | 94.1 | $84,958,366 |
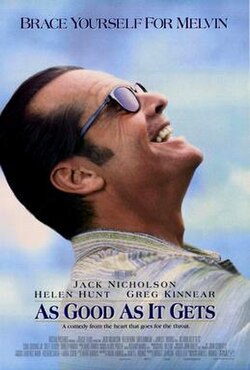 | As Good as It Gets | 1997 | Shared genres: 3 | 94.0 | $89,663,849 |
 | Coming to America | 1988 | Shared genres: 3 | 94.0 | $85,243,795 |