Synopsis
America's third political party, the New Founding Fathers of America, comes to power and conducts an experiment: no laws for 12 hours on Staten Island. No one has to stay on the island, but $5,000 is given to anyone who does.
Scores
Overall Score
81.2
Popularity Percentile (Year)
87.4%
Box Office Percentile (Year)
94.0%
Review Aggregate
44.8
Critic Consensus
Critic reception is mixed, with 55% of 175 logged reviews marked Fresh. Across reviews, critics repeatedly emphasize thin plot, political, gritty. Common reservations focus on thin plot, even when reviewers praise standout elements.
thin plotpoliticalgrittyvisually strikingdarksatiricalsuspensefulscarycharacter-drivenfunny
Cast
| Cast | Year | Reported Salary | Inflation Adjusted | Notes |
|---|---|---|---|---|
| Y'lan Noel | 2018 | $1,058,000 | $1,321,000 | (est) |
| Lex Scott Davis | 2018 | $651,000 | $813,000 | (est) |
| Joivan Wade | 2018 | $490,000 | $612,000 | (est) |
| Steve Harris | 2018 | $401,000 | $501,000 | (est) |
Aggregated Reviews
Rotten Tomatoes critic score55.0
RT critic review count175
Rotten Tomatoes audience score28.0
RT audience rating count2,500
IMDb rating5.2
IMDb votes76,274
Box Office ?
| Category | Year | Reported | Inflation Adjusted |
|---|---|---|---|
| Domestic | 2018 | $69,488,744 | $86,812,508 |
| International | 2018 | $67,567,520 | $84,412,317 |
| Worldwide | 2018 | $137,056,260 | $171,224,820 |
Earnings / Profitability
| Category | Year | Reported | Inflation Adjusted |
|---|---|---|---|
| Revenues | |||
| Theatrical Net Revenue | 2018 | $61,771,380 | $77,171,181 |
| Digital Rentals ? | 2018 | $4,184,000 | $5,227,084 |
| Digital Purchases ? | 2018 | $5,045,000 | $6,302,734 |
| Physical Rentals ? | 2018 | $2,578,000 | $3,220,704 |
| Physical Purchases ? | 2018 | $7,312,000 | $9,134,905 |
| TV & Streaming Revenue | 2018 | $17,372,186 | $21,703,127 |
| Total Revenues | 2018 | $98,262,566 | $122,759,735 |
| Expenses | |||
| Budget ? | 2018 | $13,000,000 | $16,240,941 |
| Print & Advertising (P&A) ? | 2018 | $16,250,000 (est) | $20,301,177 (est) |
| Participations | 2018 | $7,861,000 | $9,820,772 |
| Residuals ? | 2018 | $1,830,000 | $2,286,225 |
| Interest & Overhead | 2018 | $2,600,000 | $3,248,188 |
| Total Expenses | 2018 | $41,541,000 | $51,897,303 |
| Movie Net Profit or Loss | 2018 | $56,721,566 | $70,862,432 |
Similar Movies
| Poster | Movie | Year | Match | Overall | Est. Profit |
|---|---|---|---|---|---|
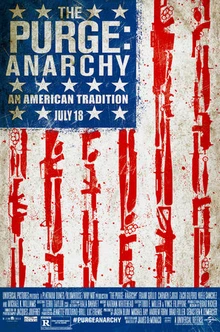 | The Purge: Anarchy | 2014 | Shared franchise (1) | 84.8 | $65,904,326 |
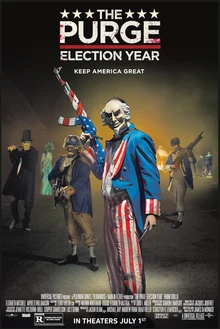 | The Purge: Election Year | 2016 | Shared franchise (1) | 81.8 | $64,895,834 |
 | The Purge | 2013 | Shared franchise (1) | 81.1 | $55,959,042 |
 | The Forever Purge | 2021 | Shared franchise (1) | 79.1 | $25,961,433 |
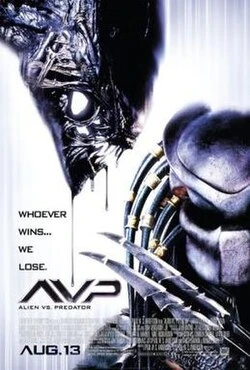 | Alien vs. Predator | 2004 | Shared genres: 5 | 82.0 | $42,918,615 |