Synopsis
An all-star baseball player becomes the unhealthy focus of an obsessive salesman.
Scores
Overall Score
64.4
Popularity Percentile (Year)
71.9%
Box Office Percentile (Year)
67.8%
Review Aggregate
41.8
Critic Consensus
Critic reception is mixed, with 38% of 13 logged reviews marked Fresh. Across reviews, critics repeatedly emphasize suspenseful, stylized, character-driven. Common reservations focus on execution consistency, even when reviewers praise standout elements.
suspensefulstylizedcharacter-drivenaction-packedemotionalvisually striking
Cast
| Cast | Year | Reported Salary | Inflation Adjusted | Notes |
|---|---|---|---|---|
| Robert De Niro | 1996 | $4,745,000 | $9,486,000 | (est) |
| Wesley Snipes | 1996 | $7,000,000 source | $13,995,538 | reported |
| John Leguizamo | 1996 | $2,199,000 | $4,397,000 | (est) |
| Benicio del Toro | 1996 | $1,798,000 | $3,595,000 | (est) |
| Ellen Barkin | 1996 | $1,538,000 | $3,075,000 | (est) |
Aggregated Reviews
Rotten Tomatoes critic score37.0
RT critic review count30
Rotten Tomatoes audience score35.0
RT audience rating count25,000
IMDb rating5.9
IMDb votes53,170
Box Office ?
| Category | Year | Reported | Inflation Adjusted |
|---|---|---|---|
| Domestic | 1996 | $18,626,420 | $37,240,968 |
| International | 1996 | N/A | N/A |
| Worldwide | 1996 | $18,626,420 | $37,240,968 |
Earnings / Profitability
| Category | Year | Reported | Inflation Adjusted |
|---|---|---|---|
| Revenues | |||
| Theatrical Net Revenue | 1996 | $9,313,210 | $18,620,484 |
| Digital Rentals ? | 1996 | N/A | N/A |
| Digital Purchases ? | 1996 | N/A | N/A |
| Physical Rentals ? | 1996 | $25,313,000 | $50,609,866 |
| Physical Purchases ? | 1996 | $29,989,000 | $59,958,886 |
| TV & Streaming Revenue | 1996 | $4,470,341 | $8,937,832 |
| Total Revenues | 1996 | $69,085,551 | $138,127,068 |
| Expenses | |||
| Budget ? | 1996 | $55,000,000 | $109,964,944 |
| Print & Advertising (P&A) ? | 1996 | $13,646,000 (est) | $27,283,302 (est) |
| Participations | 1996 | $1,382,000 | $2,763,119 |
| Residuals ? | 1996 | $4,298,000 | $8,593,261 |
| Interest & Overhead | 1996 | $8,250,000 | $16,494,742 |
| Total Expenses | 1996 | $82,576,000 | $165,099,368 |
| Movie Net Profit or Loss | 1996 | $-13,490,449 | $-26,972,300 |
Similar Movies
| Poster | Movie | Year | Match | Overall | Est. Profit |
|---|---|---|---|---|---|
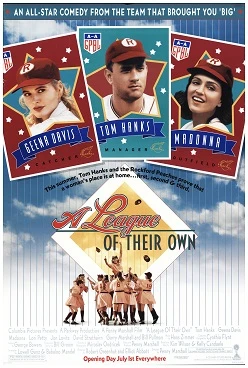 | A League of Their Own | 1992 | Shared genres: 5 | 92.3 | $88,255,465 |
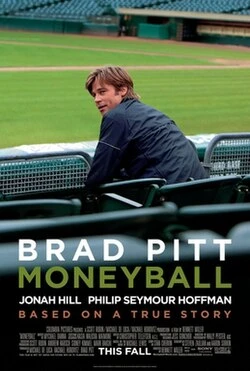 | Moneyball | 2011 | Shared genres: 5 | 92.1 | $-16,241,593 |
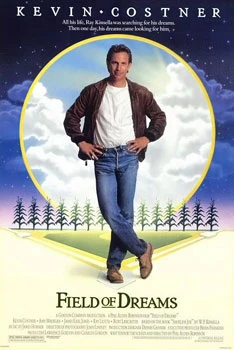 | Field of Dreams | 1989 | Shared genres: 5 | 90.3 | $74,950,144 |
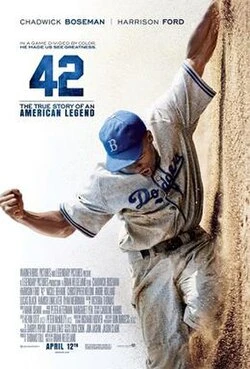 | 42 | 2013 | Shared genres: 5 | 86.7 | $16,502,357 |
 | The Sandlot | 1993 | Shared genres: 5 | 85.6 | $63,958,704 |